
Today’s chart focuses on the Euro/USD cross, from a short term and medium term perspective.
After last night’s continued falls on Wall Street and in Euro bourses, the US dollar rally has continued, best exemplified by the falls in the Euro:
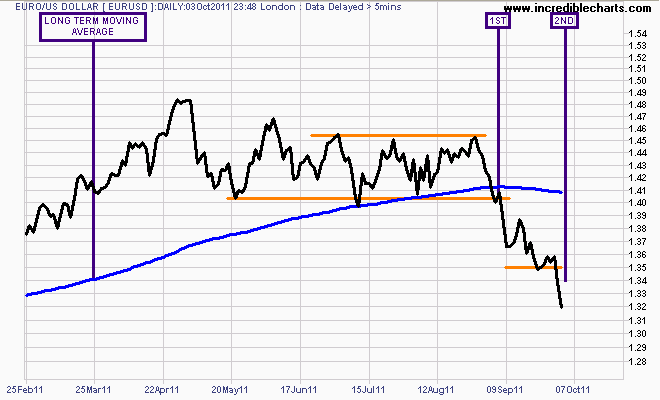
Daily chart of the EUR/USD - support lines in orange
The daily chart above shows the first breakdown in the Euro coming as the intersection of the close below the long term moving average, the weekly trend from May 2010 (see next chart) and failure of support at the 1.40 level, in the first week of September. Subsequently, the Euro found support at 1.35, but has now closed below that level.
On the weekly chart, the reversal from the May 2010 trend from 1.20 to 1.48 is clearer and in context:
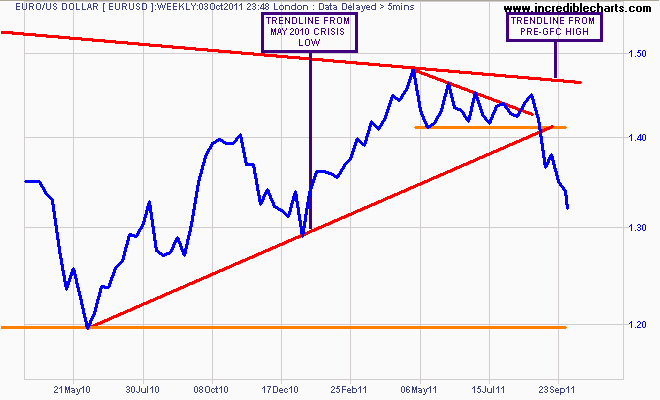
The higher trendline is from the 1.60 pre-Lehman Brothers high experienced by the Euro in mid-2008. The lowest support line (in orange) is the target level for this correction, at 1.20 which was both the low experienced in the last US dollar rally/Euro crisis and the terminus for the bear market in the Euro in 2005.