
Today’s chart comes from my favourite trader, Peter L.Brandt, and explains how the US S&P500 – the equity market that equity markets follow – is stuck “between a rock and a hard place”.
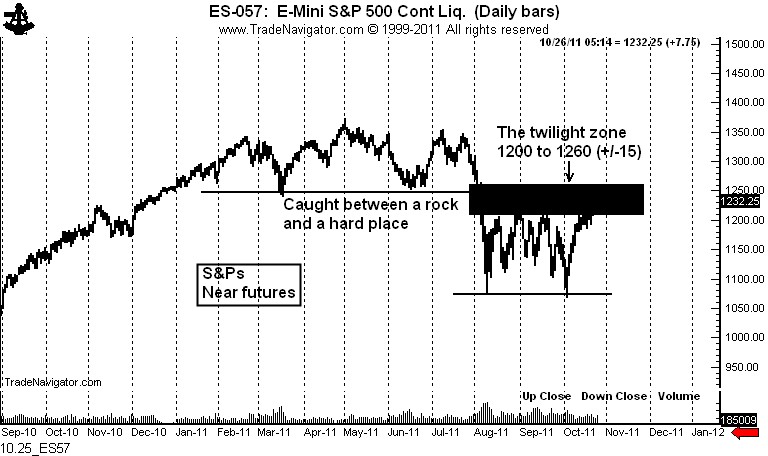
As he explains the technicals:
the market is arguably a double bottom. The other indexes do not show a similar pattern, but the S&P…fulfills (barely) the general Edwards and Magee criteria for the pattern.
In any case, I think this market will spend some time in the 1200 to 1260 range (+/- 15 to 20 points). The pattern above should keep the market from rallying too much. The pattern below will provide support.
As European markets react to the ongoing planning crisis of the next crisis that was kicked down the road, what are their charts looking like?
First, the UK FTSE100:
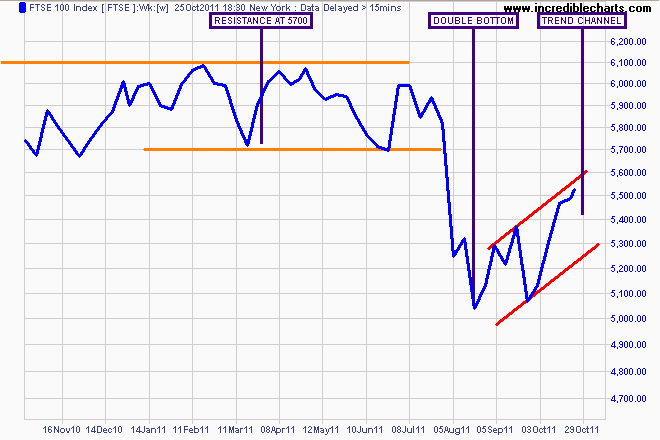
The FTSE appears the strongest, having corrected the least, with a double bottom pattern forming at 5100 points. A trend channel has developed since, with the market looking to pass through resistance at 5700 points. But it too is stuck in this Twilight Zone.
Next, the German DAX:
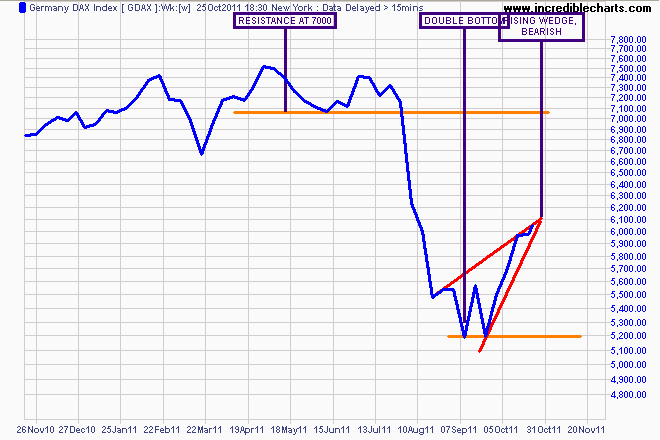
The DAX Index has a double bottom, bouncing off support at 5200 points to just peak over 6000 – a 15% rally. However, a bearish rising wedge pattern has formed, as the German bourse is reluctant to be bid above its early August crash low (around 6200 points). Another similarity with the S&P500.
And then the French CAC:
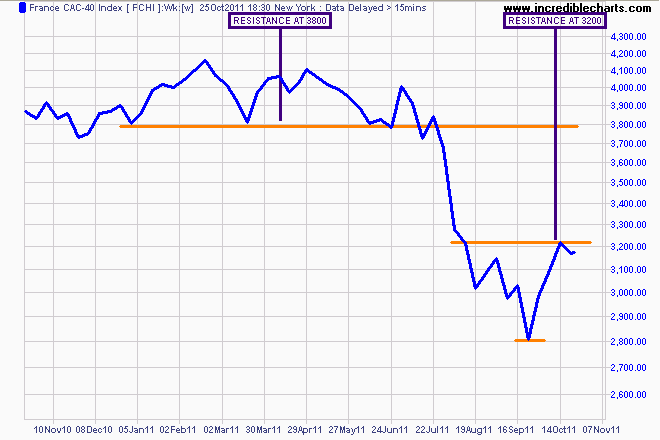
The CAC40 Index has bounced off its low at 2800 points (only 10% or so above its March 2009 low) before hitting resistance at 3200 points. This is the weakest of the 3 main European bourses, possibly reflecting its economy, and the impact on its credit rating (and banks) of any bailouts.