
Sydney is different. Since 2003 rents have risen faster than prices. I imagine the rest of the country would find that hard to believe, given their experience. But this is just one piece of evidence to show that the property cycles in Australian cities are non-synchronous.
The past 25 years data shows that the Sydney residential property market is the least volatile, and is always first to boom. In fact, you can chase the price growth ripples from Sydney and Melbourne across the country – to Adelaide, Brisbane, Perth then Darwin. This might be one reason that such divergent opinions exist in the media, academic and professional circles about residential property market conditions.

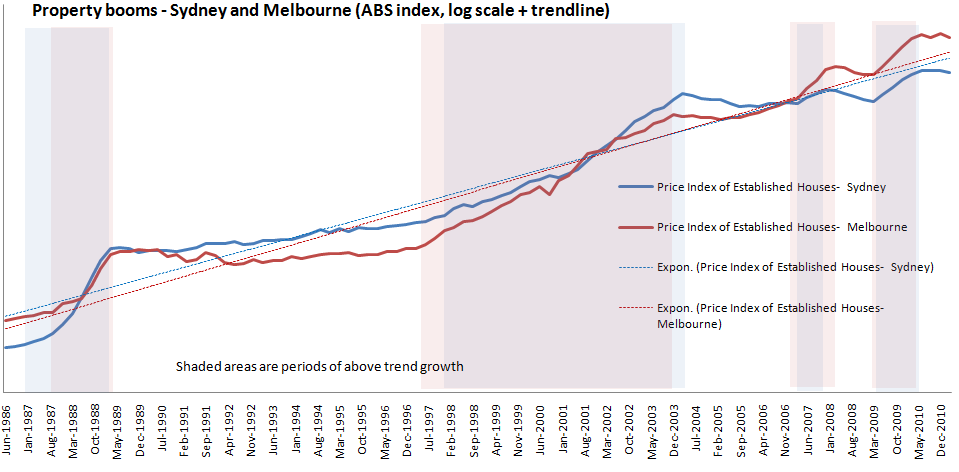
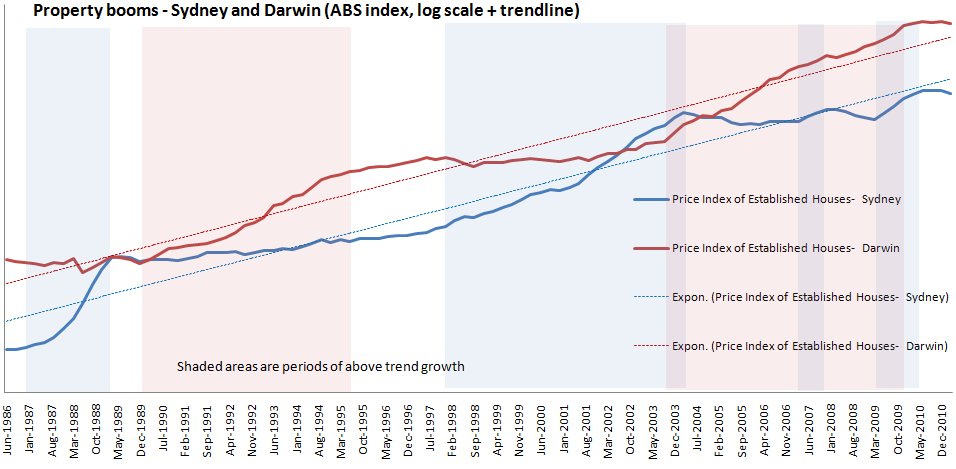
The above graph shows the two biggest markets, and arguably most attractive cities, have had the least growth since 2000. That seems particularly counterintuitive. But if we look long term the explanation is clear – Sydney and Melbourne began their major boom years before the other capitals in the mid 1990s.
Each of the charts that follow this post compare the timing of booms in capital cities against Sydney’s booms. This exercise reveals a number of things.
- Sydney and Melbourne booms in the 80s and 90s started and finished within a year of each other. In fact, their cycles are the most in synch of all markets.
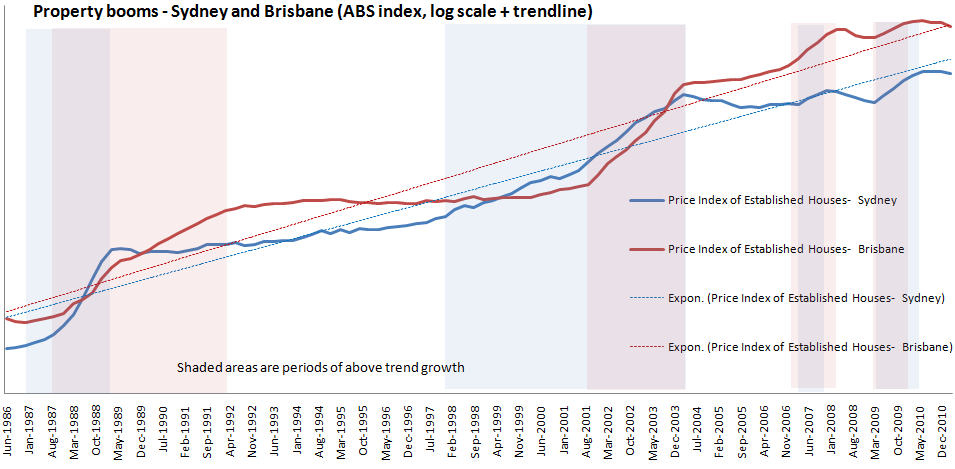
- Brisbane lagged Sydney’s late 1990s boom by 4 years – making it an early 2000’s boom. This appears connected to the fact that Brisbane’s 1980’s boom lasted about 4 years longer than Sydney’s.
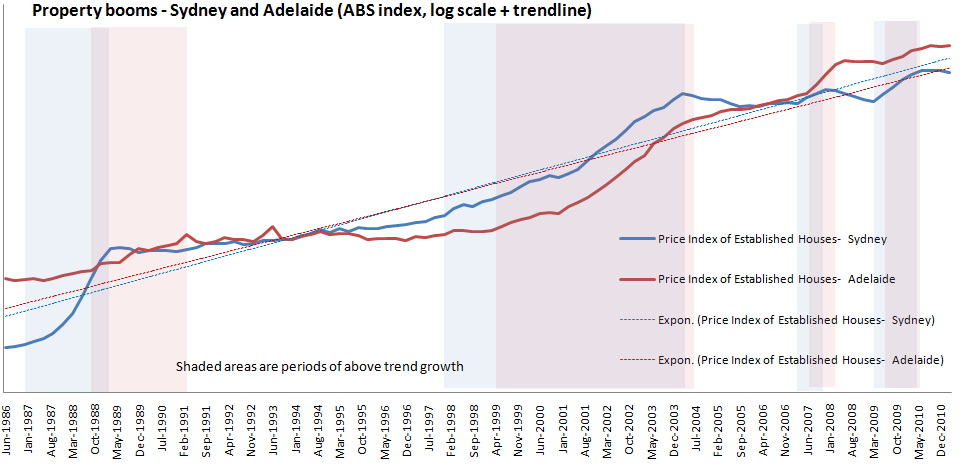
- Adelaide followed Sydney’s lead more closely than Brisbane in the 1990s, and lagged Sydney more closely in the late 1980s.
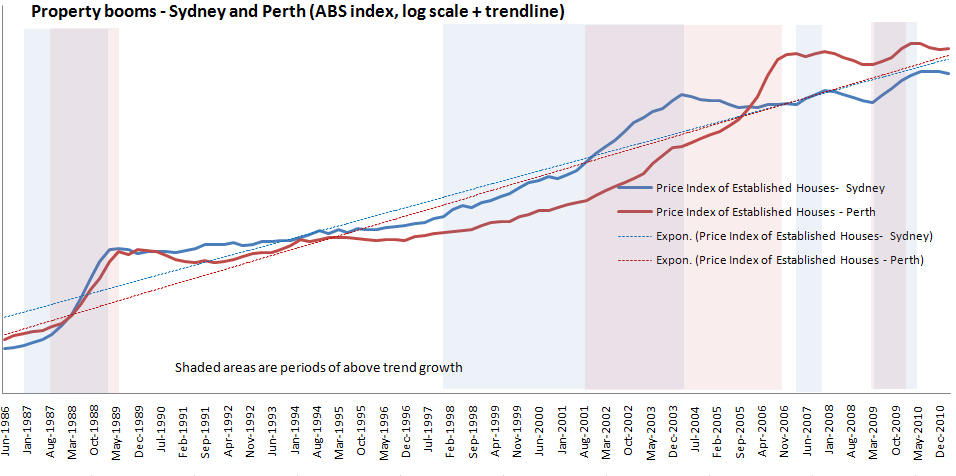
- Perth’s 2000s cycle was similar to Brisbane, although in the 1980s it had sharper and shorter price rises.
- Darwin is a world of its own – booming when other capitals had prices tracking below trend.
- Brisbane, Melbourne and Perth prices have been ‘catching up’ to Sydney over this 25 year period. This could be because the quality of homes is catching up to those in Sydney, and also due to a convergence of income levels between the cities.
- For some reason Adelaide is falling behind other major cities (lowest long term growth trend)
- Sydney never falls as far below its trend as any other city. My eyeballing suggests that price volatility is lowest in Sydney.
This might have lessons for property investors outside of Sydney. If you are in Brisbane, Perth or Adelaide and follow the Sydney trend a couple of years behind, you will do well. If prices are flat in the major capitals, take your money to Darwin.
What about from 2011 on? Sydney appears below its long term trend, and it rarely drops far below this trend. The other capitals are above their trend and do fall quite far below trend during economic downturns. My personal view is that Sydney stability will continue.
The other question to ponder is whether the trends over this past period can validly be applied from now on. Deleveraging is the most important new consideration, and we have seen the dramatic affects this can have on asset values if we look to the US and some European property markets.
My expectation is that prices will fall until such time as yields are high enough to be attractive to investors who aren’t expecting capital gains in the near future. To me, this might mean yields might get higher, relative to interest rates, than we have seen for 30 years. And for that to happen, prices will fall. Of course, if the RBA drops rates significantly, this will dampen falls, but I doubt lead to growth (not even matching inflation) for a few years yet.
Under this condition I expect price contraction to operate in the reverse pattern, starting at regional capitals and finishing in Melbourne and Sydney. The beginnings of this trend are already evident in the data, with Perth and Brisbane leading the declines.
Tips, suggestions, comments and requests to rumplestatskin@gmail.com + follow me on Twitter @rumplestatskin