Decrease in CAD equals lower GDP

The Australian Bureau of Statistics (ABS) released current account figures for the June 2011 quarter (emphasis added) today:

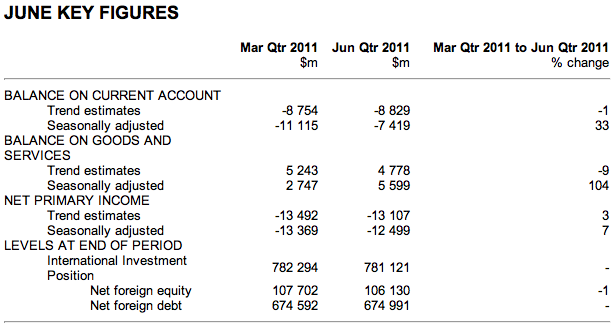
In seasonally adjusted, current price terms, the current account deficit fell $3,696m (33%) to $7,419m in the June quarter 2011. Exports of goods and services increased $5,837m (8%) and imports of goods and services increased $2,985m (4%). The primary income deficit fell $870m (7%).

In seasonally adjusted chain volume terms, the net goods and services deficit rose $1,643m (19%) to $10,224m in the June quarter 2011. This is expected to detract 0.5 percentage points from growth in the June quarter 2011 volume measure of Gross Domestic Product.

Analysts had forecast a $7.1 billion deficit, instead of the $7.4 billion result and only a 0.1% reduction in GDP growth, not the 0.5% result.

Quarterly GDP figures will be released tomorrow.


9 Responses to “ “Decrease in CAD equals lower GDP”

  1. Tomek says:

    So what would be a reasonable estimate of Q2 GDP growth now?

    I’m not sure how these figures contribute and interact with each other. Also, in the end, the ABS takes a weighted average of 2 (or 3?) methods of GDP calculation.

    I’m kind of hoping for a negative number though anything below 1.2% would indicate we are doing worse than in the 1st quarter.

    My usual peeve though is that it’s not reported as GDP per capita. You could double Australia’s population but as long as GDP goes up by $1 (plus inflation) then it’s seen as growth.

  2. Velociraptor says:

    Net foreign debt $674B. Noice.

    Nothing to see, move along.

  3. THE RECESSION PROBABLY WON’T BE TECHNICAL

    Let Australia’s real GDP, in Q4 of a certain year, be 100 (and scale the units accordingly). Now consider two scenarios. In scenario A, real GDP for the next three quarters is 99.7, 99.4, and 99.1. Scenario B is the same except that GDP in Q1 is 98.8 (instead of 99.7).

    Scenario B is clearly a worse performance. But only scenario A constitutes a technical recession, defined as at least two consecutive quarters of negative growth. In scenario A, the change in GDP is -0.3% in three consecutive quarters. In scenario B, the change -1.2% in Q1, +0.6% in Q2, and -0.3% in Q3, so that the negative values are alternate rather than consecutive; recession is “avoided” because Q1 is so bad that it makes Q2 look good!

    Scenario B is not entirely imaginary: Australian GDP indeed “grew” by -1.2% in Q1 of this year.

    Before the trade figures for Q2 were released today (Tuesday), the median forecast for GDP growth in Q2 was about +1%. In response to the trade figures and others released on the same day, the GDP forecasts have apparently been revised downwards by about 0.1% (http://is.gd/n8aATN).

    The actual GDP figure will be worse than the median forecast, because mainstream economists still underestimate the effect of a housing crash on the rest of the economy. But I will be surprised if it is so much worse as to cause negative growth in Q2; that is, because Q1 was so bad, I will be surprised if Q2 is worse. Not amazed, but surprised.

    If GDP growth for Q2 is indeed positive, the October Tax Forum will be marked by recession claims from almost everyone except governments and miners.

  4. Robert Sherlock says:

    I have being saying for weeks that I expect a negative figure.

    I was very surprised that GDP figures was going to be released AFTER the RBA meeting. Which I got some comments that they should have some unreleased info.

    This is what the RBA said today.

    “the near-term growth outlook continues to look somewhat weaker than was expected a few months ago.”

    “productivity growth has been weak”

    “softer global and domestic growth”

Leave a Reply

You must be logged in to post a comment.