
The RBA released the quarterly Margin Lending – D10 data tables today (XLS table), and its not a pretty picture for the Australian stock market.
One of the key factors in a new bull market in stocks, just like property, is a propensity for investors to borrow more on expectation of higher earnings – alongside a move to higher price/earnings ratio premia, reversal from a lower interest rate environment and the “lazy balance sheet” theory.
The ten year correlation with market values is obvious:

Margin loans vs market value for 10 years
But let’s focus on the last few years:
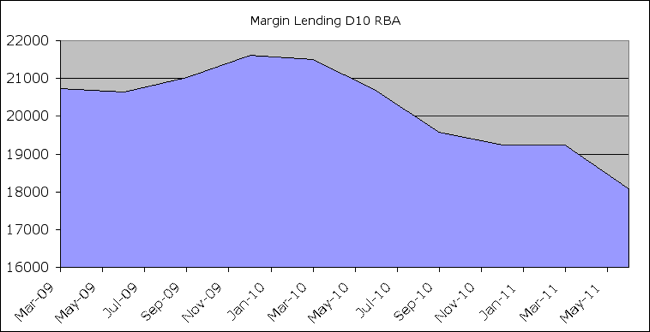
Margin loan nominal value since March 2009
The March 2011 quarter nominal value of margin loans outstanding – approx. $18 billion, is the lowest since the June 2005 quarter (approx. $18.5 billion), after rising to the heady heights of over $41.5 billion in the December 2007 quarter.
Margin debt deleveraging began in the December 2009 quarter and has accelerated, averaging 3.4% quarterly or over 12% in the last year.
This is also reflected in the number of client accounts, unadjusted for population increases, as shown below:
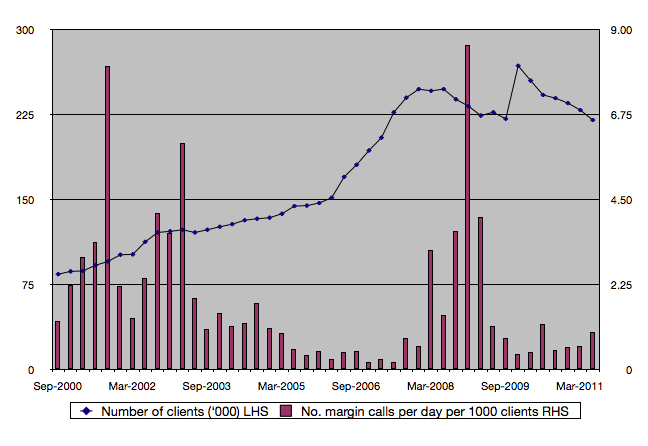
Client accounts and margin calls per day
The number of client accounts – approx. 220,000 – is now at the March 2009 low and goes someway to explain the reduced returns on the major institutional retail and wholesale investment houses (e.g AMP today). The chart above does not capture the number of margin calls during the recent market correction.
The disleveraging continues as corporate balance sheets are reducing their gearing, P/E ratio premia are falling (for the same or even higher earnings) and a central bank still torn between keeping rates steady and possibly raising them, the behavioural factors required to start a new bull market are non-existent.