
Today’s charts come from Avid Chartist, who has summarised last night (and in fact the whole week) bear action on his blog. This is a bear market – where rallies (on expectation of milky wilkies – QE, stimulus, rate cuts etc) will be sold short by traders.

The most closely watched equity market – the S&P500 – which captures the broadest measure of US stocks, has completed a head and shoulders pattern (as noted earlier this week) and has broken its March 2009 weekly trendline.
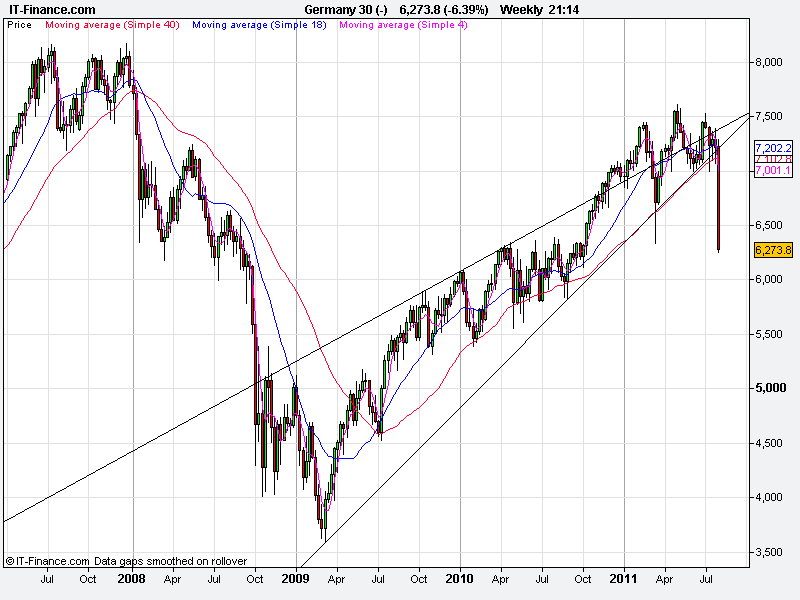
This has been followed (horrifically) by the German DAX bourse and the UK FTSE (see Avid’s full post for all the charts)
Asian markets have broken down, but not as badly as the ASX200 which is likely to open 160 points down, at 4100. That’s nearly a 20% correction from the 4976 high in May. US and EU markets are only off 8-10%. So far.