
Australian Data
A big week in Australia with the PPI and CPI data probably scaring the heck out of RBA staffers mid-week but House Price data and RBA Credit Aggregates at week’s end reminded us all that whatever you think of the mining boom and its long-term impact, the reality is that Australian households remain in a negative wealth, spending, borrowing feedback loop.
Producer Price Index

Australian producer prices rose at the final stage rose 0.8% in the second quarter easing from the 1.2% increse recorded in the first quarter. The rise, however, was higher than the 0.3% increase from Q2 last year which resulted in the annual increase in prices rising from 2.9% to 3.4%. The key was the increase in margin squeeze as preliminary stage prices continue to rise at a faster pace than intermediate stage prices which are rising faster the final stage producer prices.
Consumer Price Index
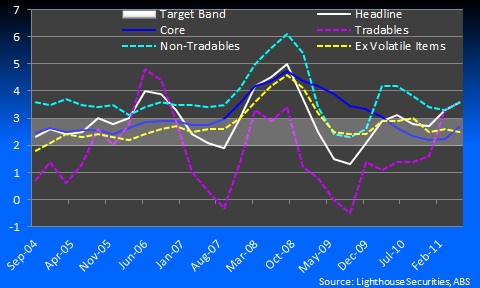
Both headline and core consumer prices rose by 0.9% over the quarter which was 0.2% ahead of market expectations. The headline annual rate accelerated from 3.3% to 3.6% while the annual pace of core inflation rose to 2.7% from 2.3% the previous quarter. What was of most interest was that headline inflation volatile items, such as fuel and food, was only up 0.5% over the quarter which was much slower than the 0.9% increase from the previous quarter which resulted in the annual rate slowing slightly from 2.6% to 2.5%, right in the middle of the RBA’s target band.
RP-Data Rismark House Price Index
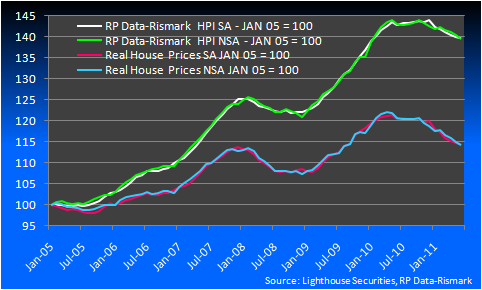
House Prices Continue to fall and although we are not seeing them “tank”, for want of a better term, the trend is clear in this chart. Seasonally adjusted, prices fell 0.2% (compared to 0.3% in May whilst the raw numbers slid 0.6% (compared with a revised 0.6% in May). The slide is looking rather like 2008, before the rescue via Government stimulus and hand outs. The budget is not in a position to do this again and deleveraging, see credit aggregates below, almost guarantees that further falls in house prices are in prospect through time.
RBA Credit Aggregates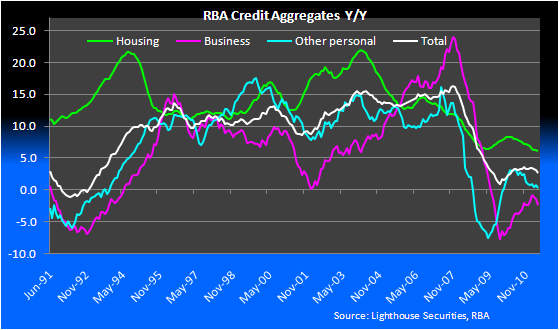
The housing complex hasn’t started to “deleverage” yet because total credit in housing is still growing at a falling rate so Australian households are “dis-leveraging”. But the release yesterday of RBA credit aggregates showed that housing credit grew by only 0.3% in June. That is the lowest increase since the 1980’s! Deleveraging can’t be far away and if you add in business and personal credit is already here for the private sector in total.
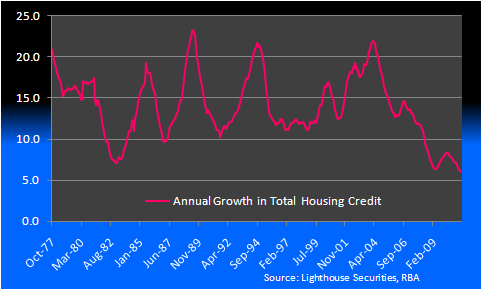
A very important chart in the context of bank valuations, in our opinion, was contained in our piece yesterday and is reproduced here. It represents the annual growth in the “stock” of Housing Credit. As you can see since the series began Australian’s have essentially been increasing the stock of outstanding debt at wary rates but INCREASING every year. Now with the growth rate at its lowest in the series history there is every chance that over the next year or so as Australians pay down debt the stock stops growing. This has massive implications for economic activity given the role debt plays in a modern economy.
Offshore Data
Offshore it was a busy week but US GDP data out last night was terrible – the economy is stalling at a time when uncertainty is rising. Poison for the US and global economies.
Dallas Fed Manufacturing Index
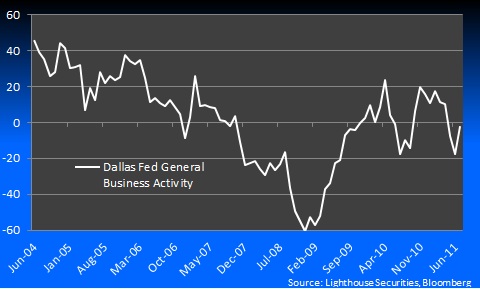 After a sharp decline of the previous four months from a 17.5in February to -17.5 last month there were tentative signs that the worst of the slowdown may have passed in July as the index climbed from -17.5 to -2. While the latest reading remains negative it does indicate that the pace of decline has slowed significantly from a month earlier. There were also some positive signs for the employment market with the Number of Employees index bouncing back to 12.1 however the growth rate of new orders remained a little soft at 2.5.
Chicago Fed National Activity Index
 The Chicago Fed National activity index, which is an index of 85 indicators encompassing the current state of economic activity and inflationary pressures in the US rose slightly in June to -0.46 after the previous months reading of -0.37 was revised down to -0.55. Despite the slight improvement the three-month moving average continued to slide and when charted against the annual pace of GDP growth points to a further slowing of growth in the second quarter. If the correlation between the CFNAI and GDP were to hold and the annual rate of growth slow below 2% in Q2 then it would imply that growth over the quarter would be less that 0.5% annualised or around 0.1%
UK Q2 GDP
 Despite monetary policy remaining extremely accommodative with the cash rate at a record low of 0.5% and £200bln in Quantitative Easing completed to date, economic growth in the UK continues to slow. Growth increased by 0.2% over the quarter with the annual pace of growth slowing from an already weak 1.6% to an anemic 0.7% with the economy only growing by 0.2% over the past 9 months. With the UK Government pursuing a rather rigorous austerity program to address the countries ailing public finances growth in the home country is likely to remain weak for some time.
US S&P-CaseShiller house price index
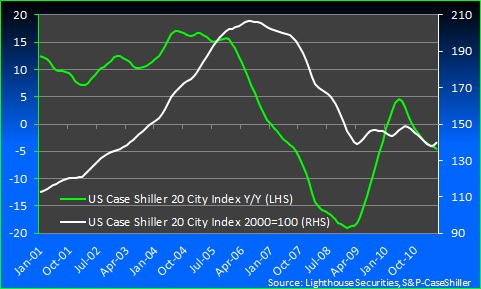 House prices remained subdued in the US in May with a small fall over the month pushing the annual rate down to a decline of 4.5%. The most recent fall takes the peak to trough decline from the July 2006 high in excess of 32%. Fortunately the pace of decline has slowed and prices appear to be forming a bottom however after two false starts already we hope it is third time lucky and this is the low for US house prices.
US new home sales
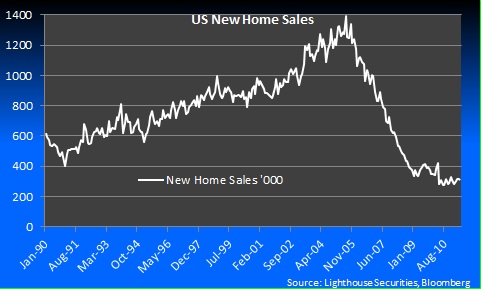 New home sales in the US continue to disappoint, falling by 1% in June to an annual pace of 312,000 sales after the were expected to increase to an annual rate of 320,000. New home sales have now largely been stagnate for the best part of 12 months around their lowest level on record going back more than 50 years. While ever their remains excess housing stock on the market, which is also providing headwinds for prices, then new home sales are expected to remain weak.
Consumer Confidence
 There was some positive news out of the US with consumer confidence unexpectedly rising according to the Conference Board’s consumer survey. The index rose to 59.5 from a revised 57.6 after it was expected to fall to 56. However in the grand scheme of things the move is rather immaterial with overall confidence according to both the Conference Board’s survey and that from the University of Michigan at ver depressed levels.
US durable goods orders
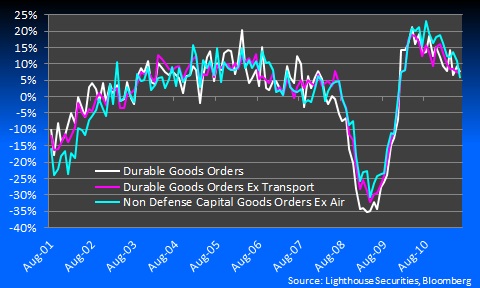 Orders for durable goods were quite disappointing in June with total orders falling by 2.1% after the were expected to rise by 0.3%. Orders ex-transportations performed a little better, rising 0.1% over the month however the too fell short of expectations while capital goods orders excluding defense and aircraft related purchases fell 0.4% against expectations of a 1% rise. The key is that the growth rate of orders is clearly slowing after the post GFC stimulus driven bounce back towards their long run average.
Initial jobless claims
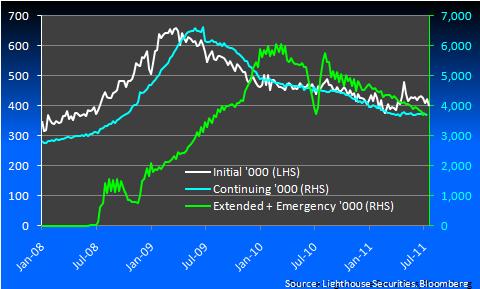 Initial jobless claims fell far more than expected in the week ending July 23, with claims dropping from a revised 422k to 398k against expectations of a drop to 415k. The drop below 400k for the first time in over three months could be the first sign that the softness in employment over the last few months may have passed. However of some concern to us is he steady decline in extended and emergency benefits as we suspect that these people are no longer eligible to continue to receive assistance rather tha gaining employment given the weak level of jobs growth.
Pending home sales
 Pending home sales also provided some positive news with the index climbing 2.4% in June after the market had been expecting a fall of 2%. The pending home sales index has had a long run correlation with actual existing homes sales which is to be expected and suggest that we should see a small increase in exiting home sales next month
US GDP
 After the release of the Chicago Fed National Activity Index earlier in the week we suggested that there was downside risk to the GDP outcome for Q2. While we suggested we could see an annualised rate of around 0.5% for the quarter which would result in the actual annual pace of growth dropping below 2%, the final outcome came in above that expectation at an annualised rate of 1.3%. However a substantial negative revision to the previous quarter which saw the annualised rate of 1.9% revised down to 0.4% means that the annual rate of growth has slowed in line with the pace that the CFNAI suggested. With the US government currently debating how to cut the country’s budget deficit which will ultimately provide a drag on growth and the Fed reluctant to embark on another round of quantitative easing, growth in the US will remain weak for some time.
Yours in data – The Lighthouse Securities Research Team.