
That is the question: today’s chart(s) are from Wilson HTM’s recent research on Australian equities which was prompted by Sell on News recent article on what is the fair value of the ASX200/All Ords? (h/t Damien for supplying the report)
The first chart shows the All Ords trailing Price/Earnings ratio going back to 1959:
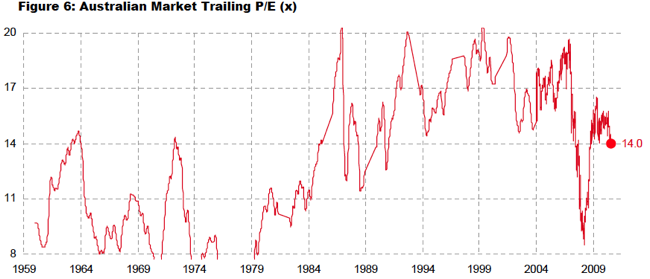
Most brokers use forward earnings, I prefer trailing (as it is concrete – forwards are estimate only and always subject to revision) for comparison purposes.
What is obvious in this chart (and in any decent research) is that in a low inflation, “Great Moderation” environment, there is always a prospensity to bid up stocks – i.e pay more for the same earnings. The normalised trailing P/E of the last 30 years has almost always been above 14 times (the two exceptions were the bubbles in 1987 and 2007).
Now that we are approaching (or stuck within) a higher inflation, lower GDP growth, stagnant/disleveraging credit environment, what do you think is the most likely range of P/E measures? The same as the last 30 years – or perhaps a range below that, as experienced before the Baby Boomers discovered stocks?
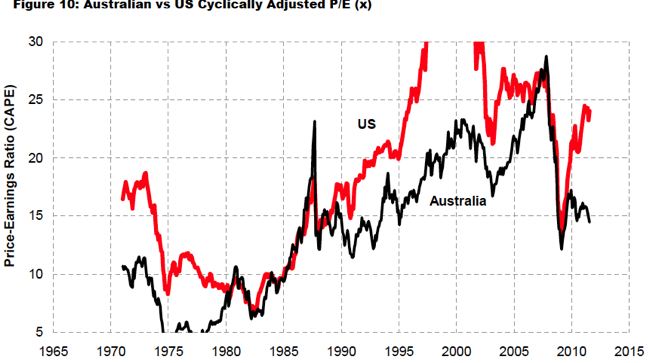
The second chart compares the Shiller Cyclically Adjusted P/E ratio (or CAPE) of US and Aussie stocks. At Empire Investing, we use a version of this CAPE (which irons out the cycles within a market, adjusting earnings for inflation).
What is clearly evident is that our two stock markets roughly follow the same risk premia – although the US went nuts during the tech boom, whilst we caught up during the first Chinese bubble from 2003-07. The US, through fiscal and monetary stimulus and extreme cost cutting (i.e jobs) has been able to create huge margins and hence profits for its industrial companies and stands at very high CAPE. Our market in comparison has disleveraged, raising capital to pay down debt (and only getting a sub 10% return on that equity) whilst retaining (expensive) jobs and absorbing continued regulatory uncertainty amongst tightened margins.
Again notice before the 30 year megaboom, the CAPE was below 10 times – a more appropriate measure for potentially low earnings, due to margin pressure, inflation and tax constraints on industrial companies.