
I stated yesterday that my data was only for March 2002 onwards because that is when the ABS house price index data began. A reader mentioned that in fact there was also another dataset available so I decided to recheck my theory against this data.
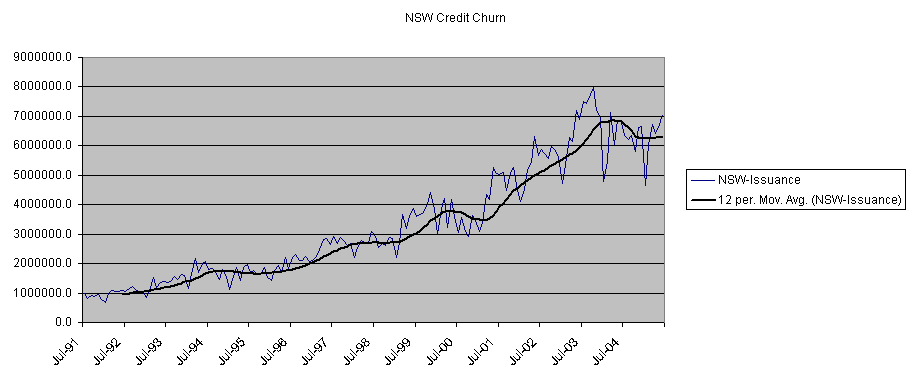
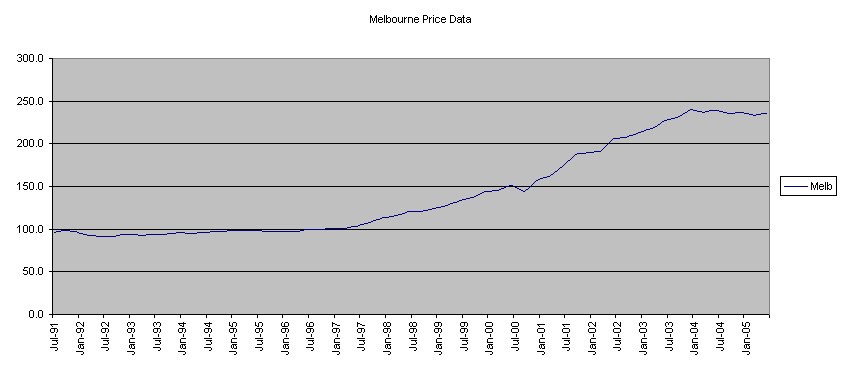
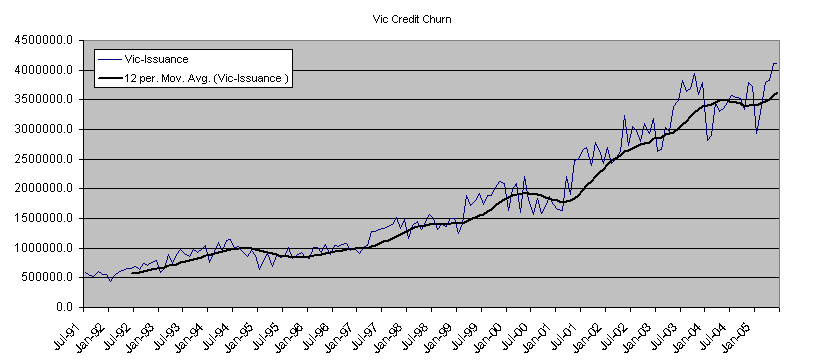
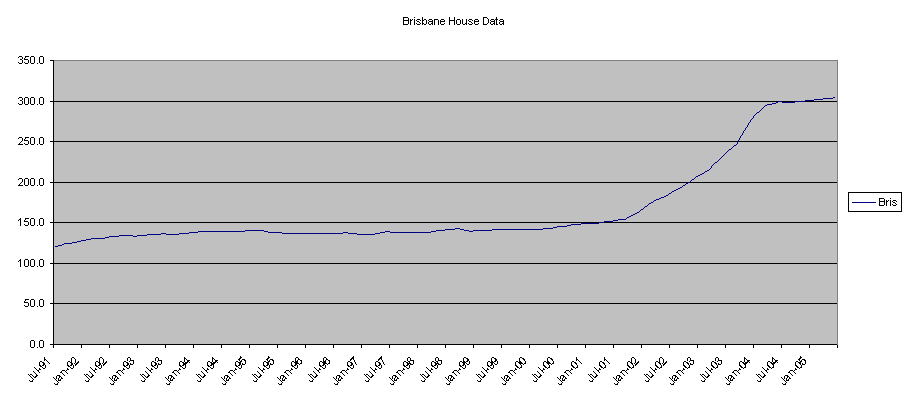
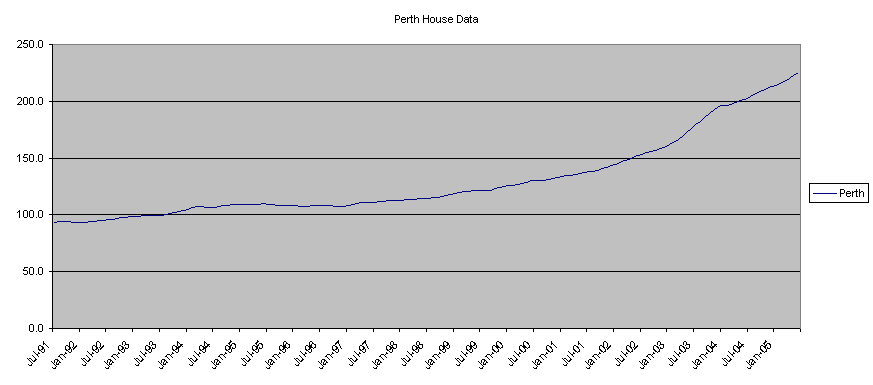
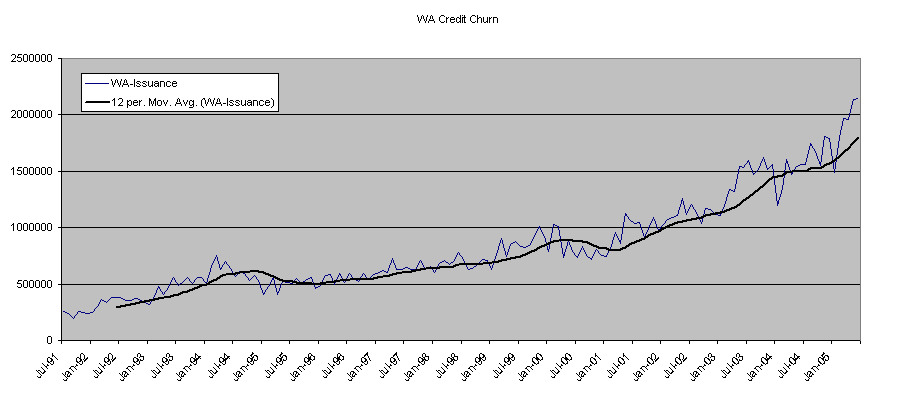
The city “house price” charts below are simply based on the data in the new dataset. The “credit churn” charts are created from the ABS state data for financial commitments for owner occupiers and the ABS state data for commercial finance commitments
The charts are as follows.
For Sydney:

And NSW credit churn:

For Melbourne:

And Vic credit churn:

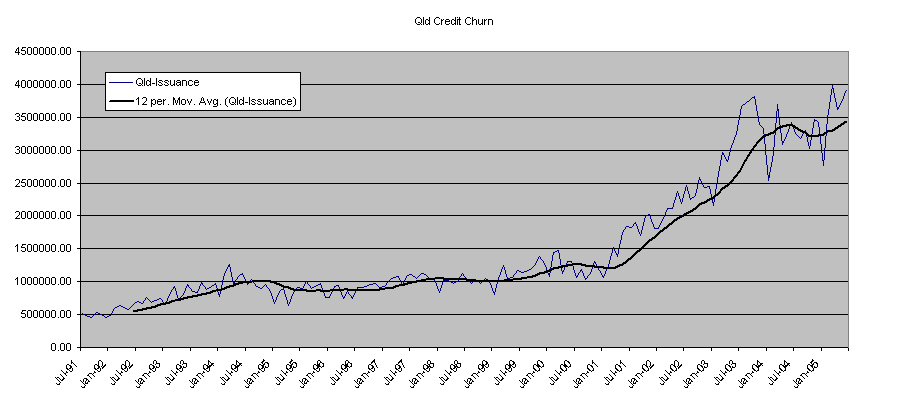
For Brisbane:

And Qld credit churn:

And finally Perth:
")
And WA credit churn:

As far as I can tell in all markets above from 1991 until 2005 the rate of monthly issuance of credit was tightly coupled with changes in house prices. Again I am happy to be proved wrong. But given this data I would suggest that watching changes in housing market transactions, and therefore credit issuance, is an exceptionally good indicator of future house price movements.