
Barclays with the note. Some nice charts and sensible analysis here.
More upbeat, but hard to see a sustained rebound in consumption
The complete set of holiday travel and spending data offers ome insights ahead of the January-February activity-data release (18 March), and for Chinese households latest travel preferences and spending patterns (see Figure 5 for detailed data and comparison versus 2019/23).
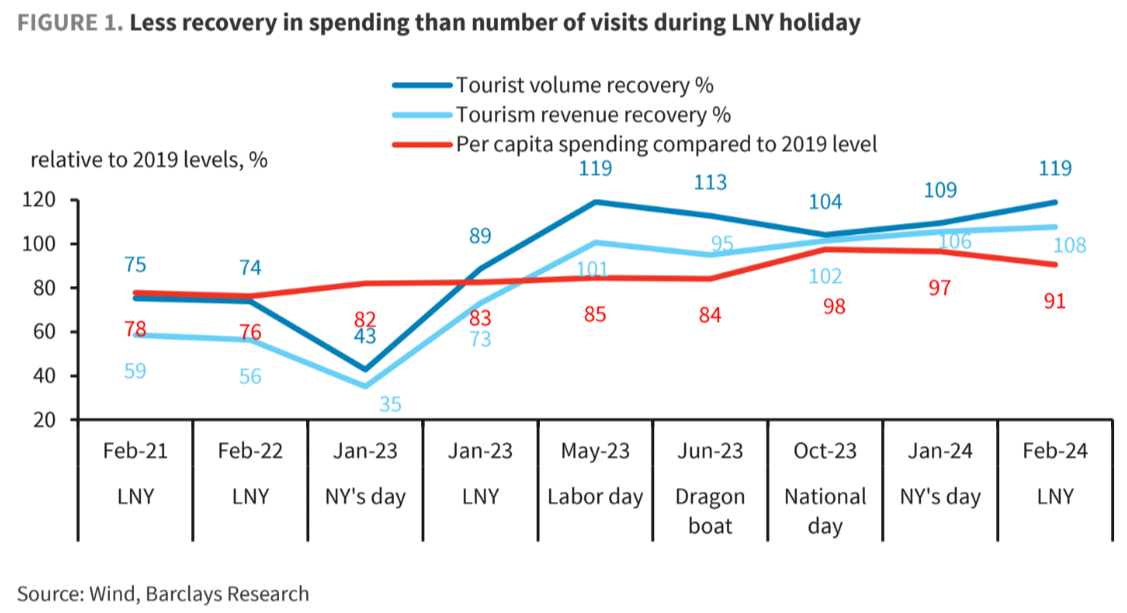
For domestic travel, the data support our prediction of upbeat travel sentiment and strong numbers, but with the recovery in spending lagging the number of visits (Figure 1, and China Outlook: Too early to cheer in the Year of the Dragon, 16 Feb 2024). For overseas travel, there is limited data availability, but we think similar conclusions can be drawn: less expensive short-haul trips to Asian countries are being favoured despite the surge in tourism volume.
Overall, we remain sceptical of any sustained strong recovery in consumption as some strong LNY holiday data were already factored into our base forecast (China: Lower expectations for recovery, 17 Jan 2024). We take the seemingly strong holiday consumption data with a pinch of salt.
We think the data were boosted by 1) a longer-than-usual LNY holiday this year (8 days vs 7 days in the past years), and 2) a release of pent-up demand (“revenge” travel), both for domestic and overseas travel, given this is the first “normal” LNY since 2020. And we note some drop in percapita spending compared with holidays in Q4 , and more signs of deflation expanding fromgoods into services.
The better data, in our view, may also reflect lowered expectations into the LNY holiday amid ameltdown in the stock market, the deepened property downturn, and worsening income andwealtheffects.
This can be seen from the Bloomberg survey on 22 January, which expected an”insignificant uptick in outbound travels except for short-haul trips, and spending sentiment stays at reopening trough”.
Deflation was seen expanding from goods to services consumption as shops offer price cuts to lure visitors.
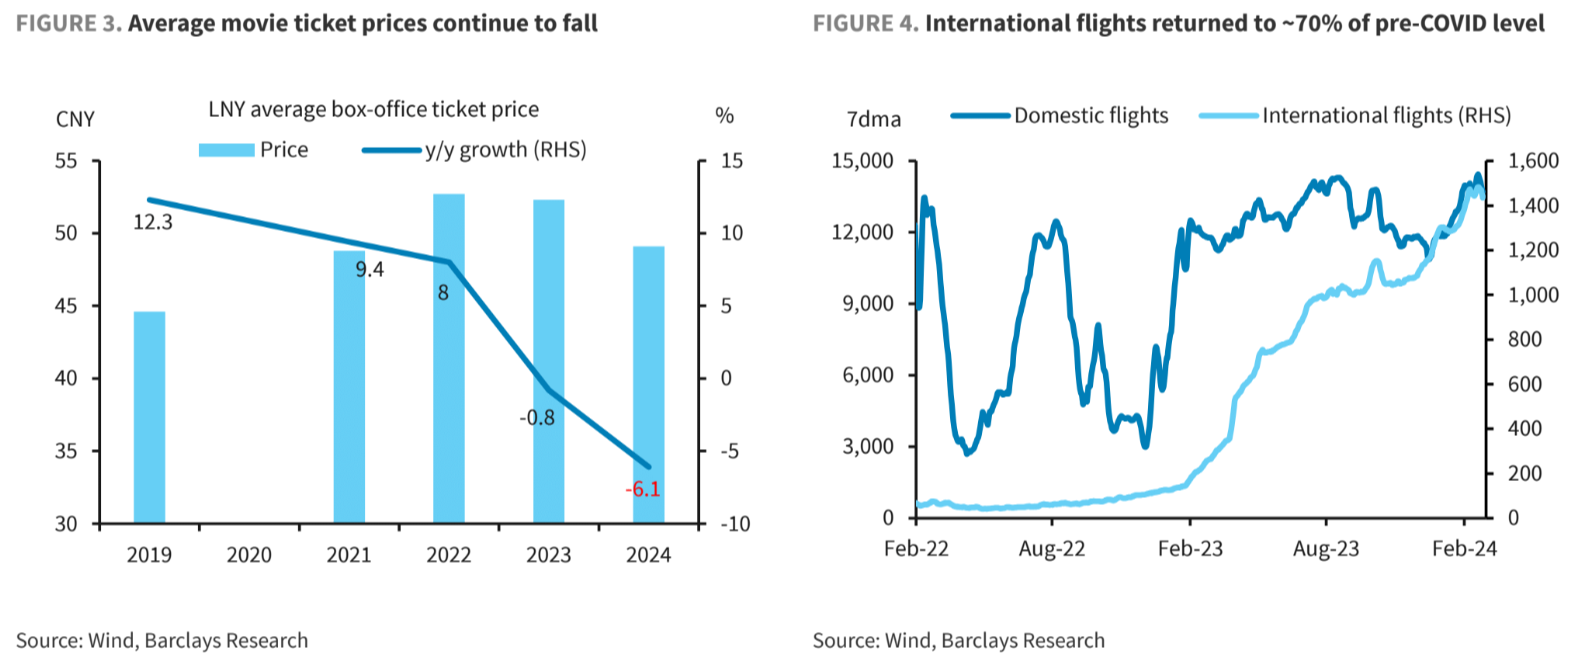
Average movie ticket prices were down 6.1% this LNY compared with the same period last year, and the decline was seen in different tiers of cities, according to Maoyan Entertainment (Figure 3).
On a per day basis, box office revenue only rose 2.9% during this LNYvs the same period a year ago.
Meanwhile, average price paid per night at B&B (bed andbreakfast) was down almost 40% during the same period.
Moreover, we see signs of a decline in meal prices and expenses.
For instance, KFC’s China outlets cut the meal combo (a burger, fries and soft drink) to as little as CNY20 (USD2.80), almost a ~30% decline versus a year ago.
The average receipt at Pizza Hut Stores came down by 25% to CNY90 in February from CNY120 in 20173.
Similarly, the prices of big ticket items continued to decline during LNY, with some well-known auto brands (e.g. Tesla, Li Auto, BYD) offering discounts as steep as 3-10% in LNY, according to Huxiu.
It is worth highlighting that auto CPI already fell for 12 straight months, with a cumulative decline of 5.6% in the past year.
A catch-up move on 5y LPR unlikely to turnaround the property sales
Following the unchanged MLF rate last week, the PBoC on 20 February kept 1y LPR unchanged dat 3.4%, while guiding 5y LPR (linked to mortgage rates) lower by 25bp.
Such asymmetric LPR moves, in our view, suggest authorities are under pressure to stabilise the property market as the contraction in home sales widened further YTD.
We tend to view the cut in 5y LPR as a catch-up move, as banks kept 5y LPR unchanged but cut 1y LPR by 10bp after the PBoC lowered policy rate (MLF) by 15bp last August.
In terms of growth, we think the boost to property sales from the latest 5y LPR cut is limited, given deteriorating labour market, and gloomy economic outlook.
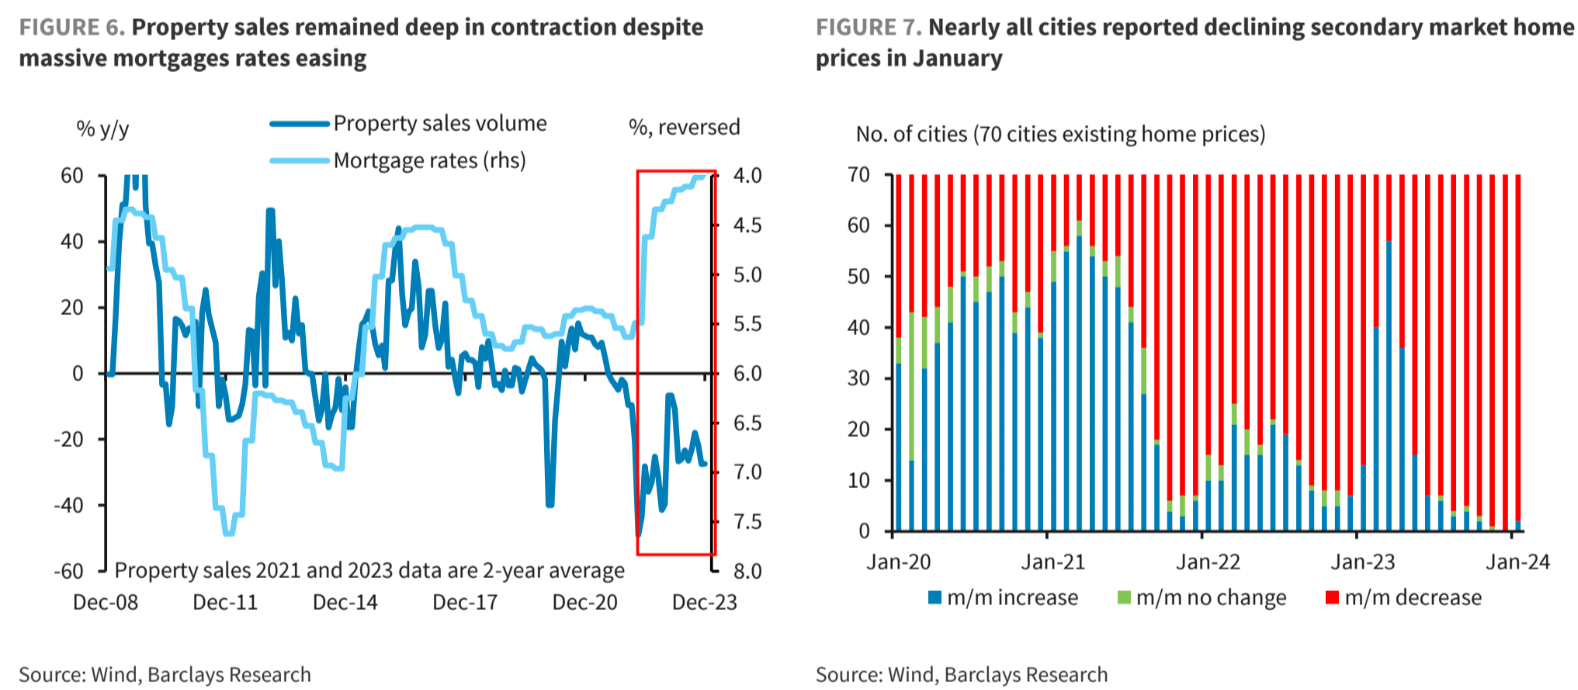
Even with over 160bp of cuts to mortgage rates in the past two years, response from homebuyers remain muted (Figure 6), with contraction in property sales widening further in 30 major cities YTD (Jan-25 Feb: -29% y/y on a 2y basis).
We think Chinese people would be reluctant to purchase property unless there are more convincing signs of rising home prices.
Official data showed that home prices in secondary market declined for a ninth month in January, albeit at a slower pace (Jan:-0.7%, Dec: -0.8%). We remain cautious on the sustainability of the improvement as the only two out of 70 cities posting a m/m increase were Kun Ming and SanYa, two popular winter tourist destinations in southern China (Figure 7).
While a 5y LPR cut could also ease the debt-service burden for existing borrowers and unleash some room for consumption, we think such a boost would be minimal.
By our estimate, a 25bpcut in mortgage rates would reduce household annual mortgage payments by CNY90bn, or only 0.06% of GDP.
Moreover, we tend to view the latest 5y LPR cut as the government’s intention to put a floor runder the housing market correction, but we do not think the government’s overall policy thinking has changed.
Similar to past years, we think the authorities will not seek short-term growth while accumulating long-term risks, with top leaders and local governments calling for officials to get used to belt tightening.
High-frequency tracking underscored more concerning signs
High-frequency data continued pointing to declining domestic demand, with limited signs of a quick and sustainable rebound in growth momentum and housing and consumption remaining the two main pain points, as discussed above.
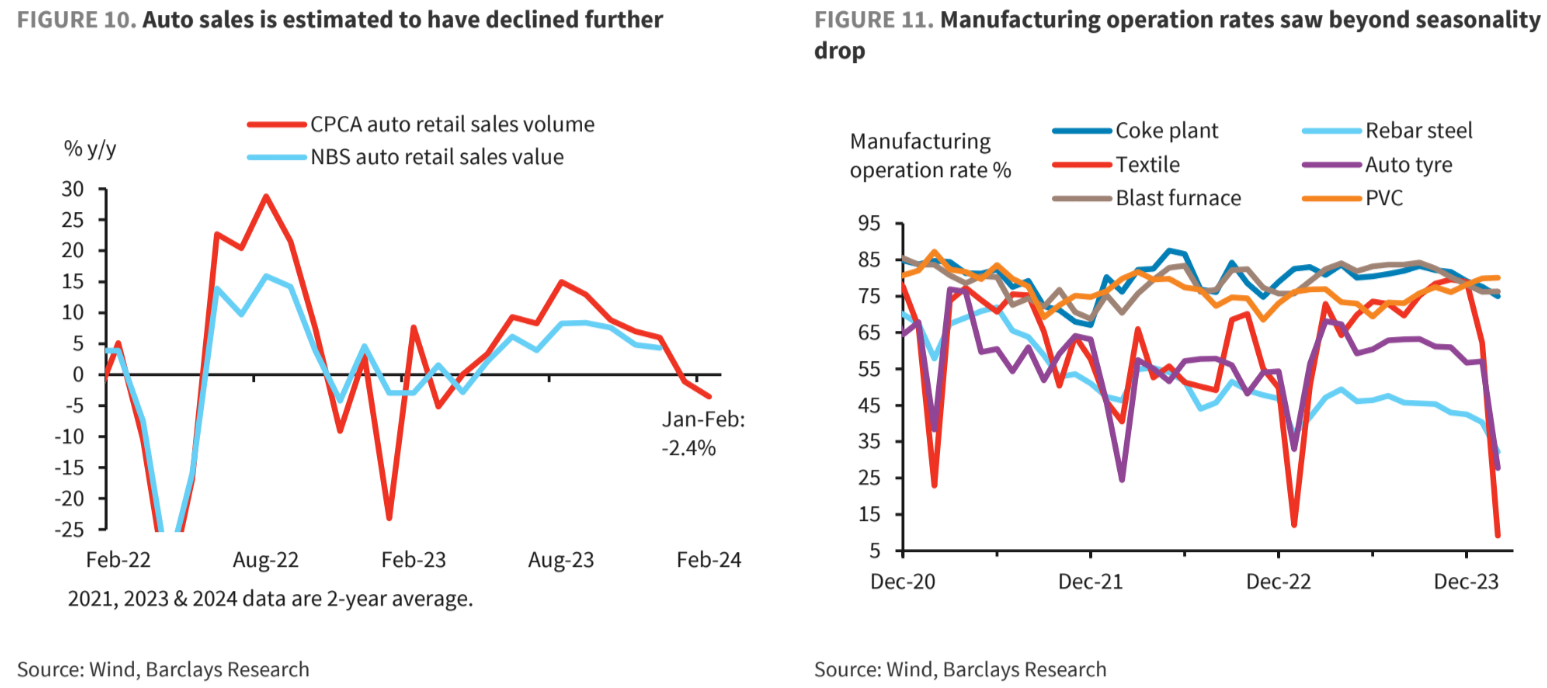
Auto sales, one of the main big-ticket consumption items, is estimated to have fallen by 2.4% in January-February, according to the CPCA, compared to a 6% increase in December (Figure 10).
In the struggling property sector, monthly and high-frequency sales data point to further declines into February.
New home sales from the leading 100 developers slid by 34.2% y/y in January (or -47.9% m/m from December), the worst month since at least July 2020, according to China Real Estate Information.
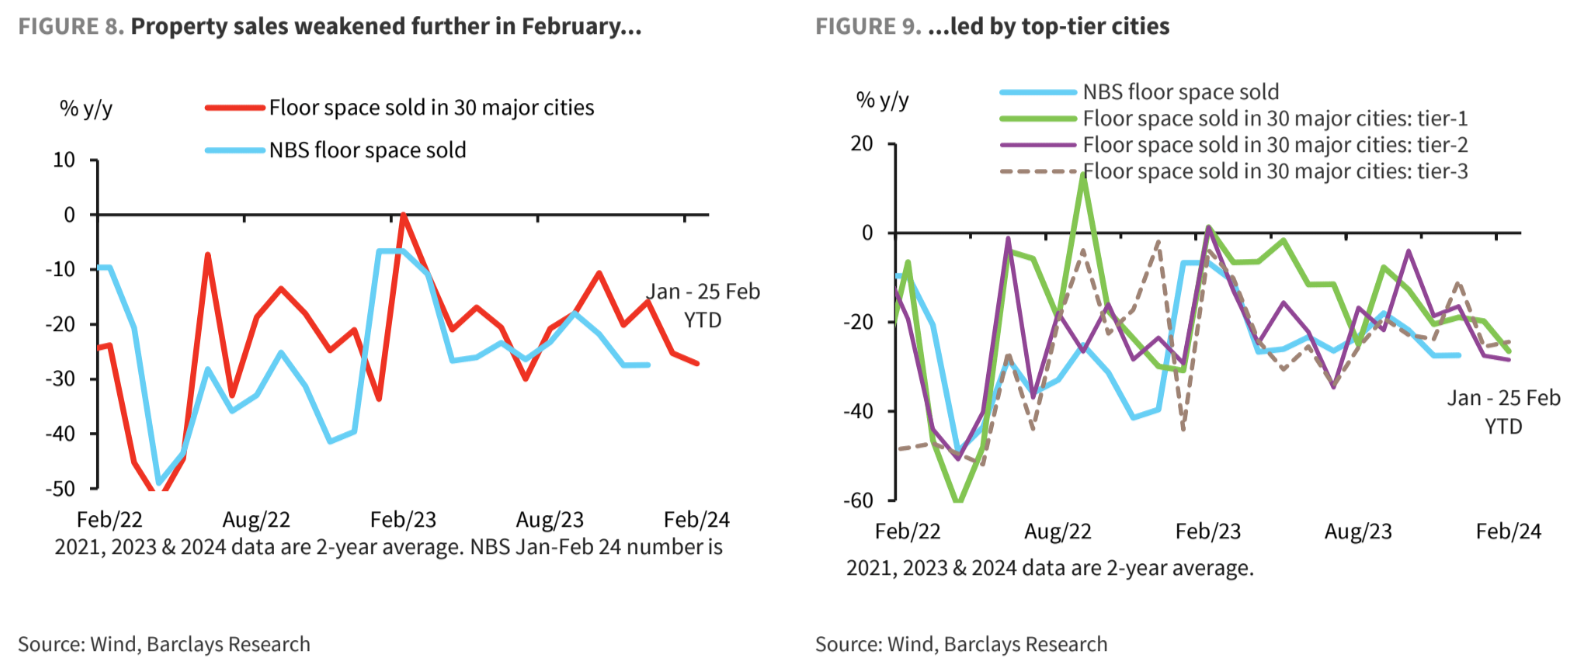
February sales likely have worsened (Figure 8). Our high-frequency tracking shows that property sales in 30 major cities fell by nearly 38% as of 25 February (on a 2y basis), led by top tier cities (Figure 9), after declining 25% in January (on a 2ybasis).
Meanwhile, we note manufacturing operation rates declined in February in a wide range of industries during the LNY holiday, including mining & smelting, textile, auto, and petroleum/asphalt equipment, except blast furnace and PVC (Figure11).
Specifically, we note the drop in operation rates in most industries exceeded expected seasonality, a sign that weak domestic and external demand continues to weigh on the manufacturing sector.
In particular, operation rates among textile firms fell sharply to only 9% from 62% in January, in contrast to an average of 25% in the LNY months during the past three years.
Credit growth stabilised, but still too early to cheer
China’s credit data made a good start to the year, with growth in January total social financing(TSF) stock stabilising at 9.5% y/y.
We think the solid headline credit data partially reflect: 1) stepped-up monetary and credit policy support, 2) some property-loosening measures that have boosted secondary market home sales.
While credit data beat expectations, the potential boost to economic growth remains to be seen, especially as corporate long-term loans have been declining for seven straight months.
We think the underlying strength is likely weaker than the headline print suggests.
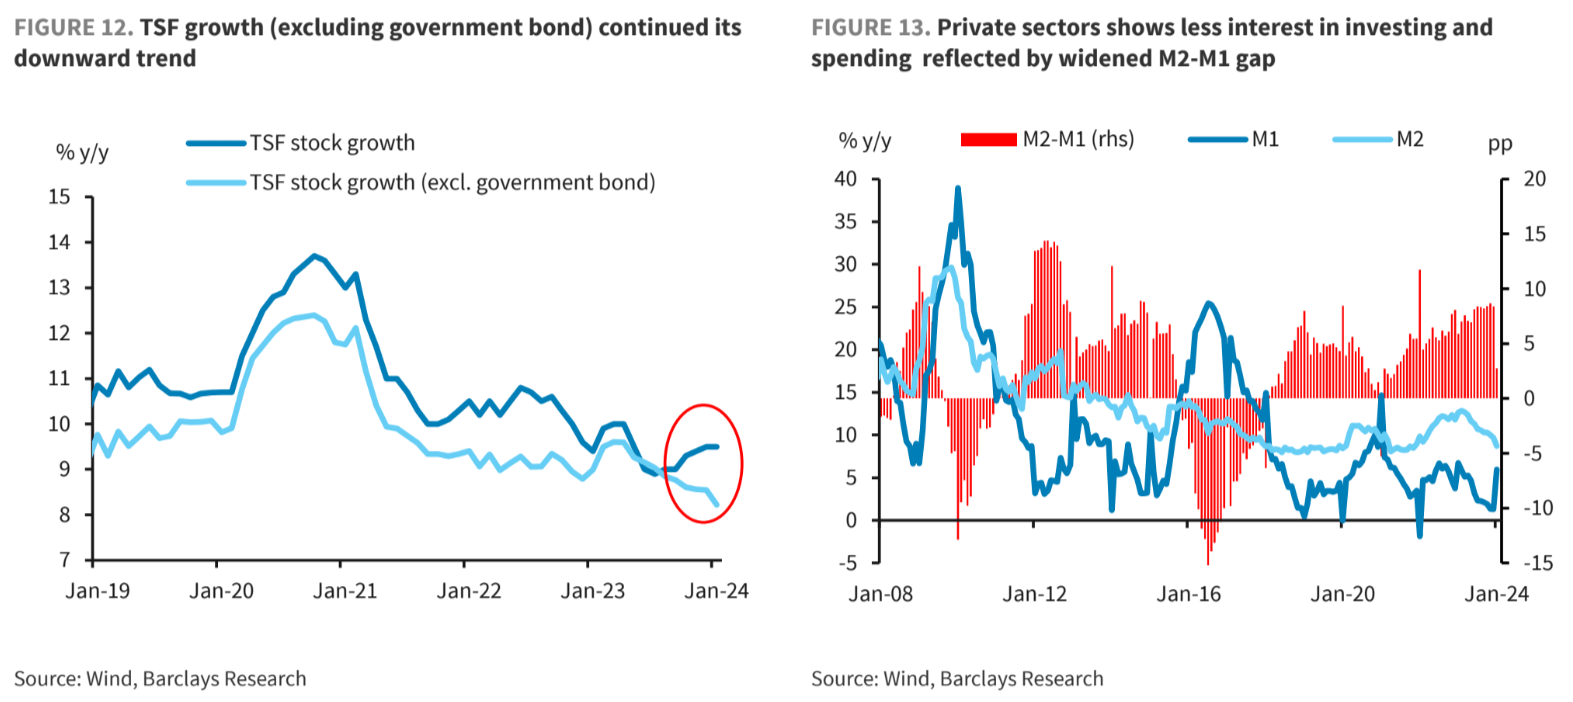
•We note a widening gap between headline TSF growth and TSF growth excluding government bonds (TSF ex-GB), with the latter on a declining trend and the former stabilising (Figure 12).
We find the sustained decline in TSF ex-GB growth a concerning trend.
In our view, this likely reflects weaker credit demand in the private sector and their muted response to the central bank’s credit loosening (Figure 13).
The TSF data does not provide a breakdown of corporate loans into state versus private, we think the divergent trends between (contracting) private investment and (rising) public/SOE-led investment suggests: 1) more lending was extended to SOEs for state-led investment projects; and 2) credit demand from non-SOE/private firms likely weakened, and small firms PMI (mostly private firms)remained below 50.
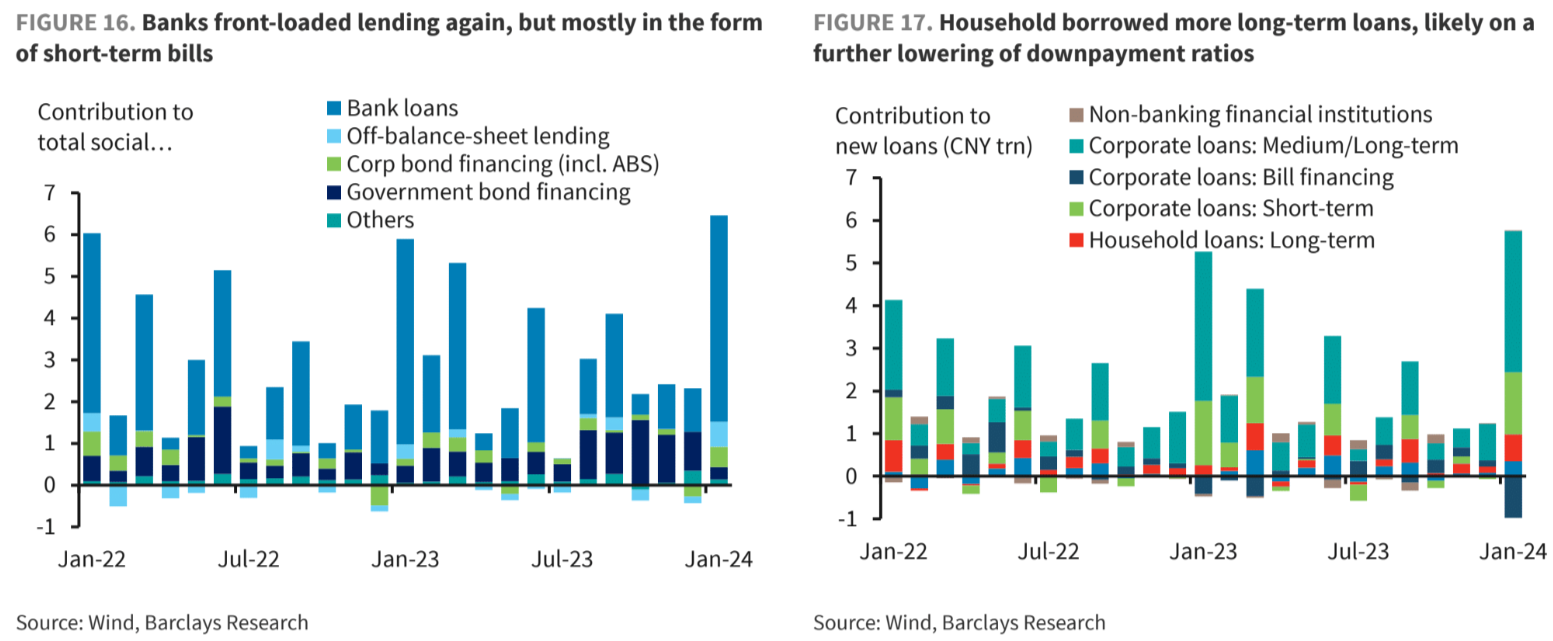
•A large portion of the increase in January total social financing was driven by a rise in undiscounted bank acceptance bills, which we think underscores still-sluggish loan demand in the real economy.
In the past, banks tended to allocate some of their loan quota to corporate short-term bills to meet credit issuance targets when loan demand is weak.
In this regard, we think it is worth highlighting that corporate long-term loans weakened for the seventh consecutive month (Jan: CNY3310bn; a year ago: CNY3500bn).
This, in our view, reflects a continued reluctance among (private) corporates to make long-term investments due to the uncertain economic outlook.
•Household long-term loans unexpectedly rose to CNY627bn in January, from CNY223bn ayear earlier (Figure 17).
This is in sharp contrast to the deep contraction in new home sales in January.
We think the jump in household loans could be attributed to a further loosening of mortgage rules, especially those around down payment ratios for second-time home purchases in the major cities.
For example, on 14 December, Beijing and Shanghai finally made a significant cut of downpayment ratios to 40-50% (from 70-80%) for second-time buyers, and to 30% from 35% for first-time home buyers.
This has allowed homebuyers to take out more bank loans when purchasing a home.
We note secondary market property sales improved in China’s major cities (ie, Beijing, Shenzhen) in January, helped by sellers offering steeper discounts.
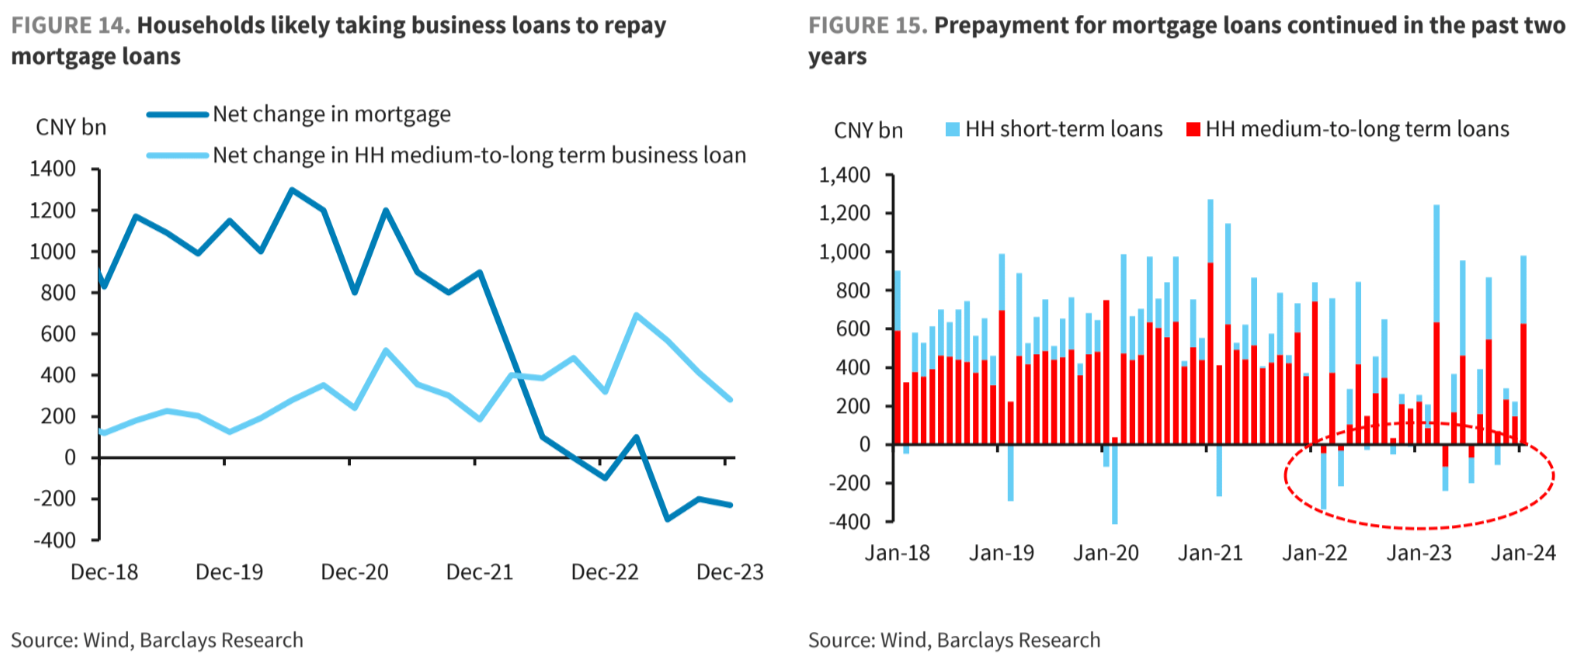
It is worth noting that Chinese households have been deleveraging over the past two years and paying offhome loans ahead of schedule (Figure14,15).
Overall, despite stepped-up monetary and credit policy easing support measures, our base case is for credit growth to moderate to 9.0-9.2% by the end of 2024, from 9.5% in January, in view of weak credit demand in the private sector amid the prolonged housing slump and continued lacklustre consumption.
Our credit growth forecasts are based on the following assumptions: 1) an ~8% decline in property sales (vs -8.5% in 2023); 2) ~5% growth in auto sales (vs 12% in 2023); 3) ~3% growth inFAI (vs 3% in 2023); and 4) government bond financing equivalent to 6.8% of GDP (vs 6.8% in2023), with 3% financed by LG special bond issuance, and 3.8% financed by (special) treasury and LG general bond issuance.
Risks to our credit growth forecasts are tilted to the upside, as the government could increase bond issuance after the March NPC meeting, if growth momentum is deteriorating further by that time, similar to the experience last year.
This adjustment would be hard enough if China did all the right things. But it is reacting far too slowly and embedding deflationary trends and expectations.
Expect much more and much worse over a long period of time as China slides inexorably into Japanification.
