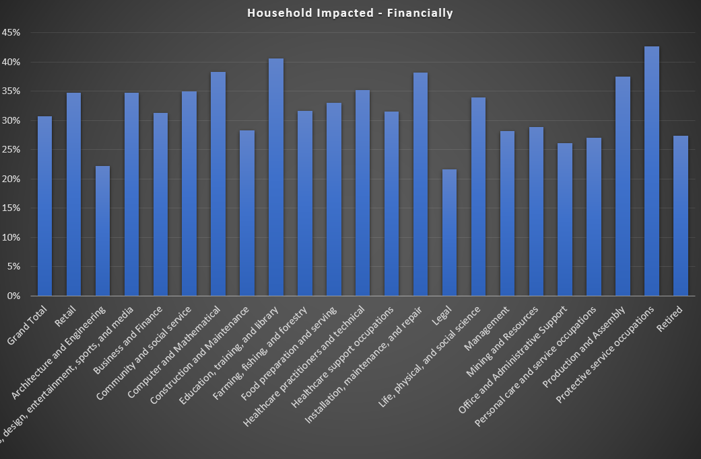
In our surveys we asked two questions. First, have household finances been impacted by the virus/economic slow down, and second, how. Overall 36% of households have been adversely impacted by COVID from a finance perspective. However this does vary by industry, for example, more than 40% of those in education have taken a hit, whereas those in the legal profession are at 20%. Protective services was high, thanks to the closure of transport hubs and other public spaces.
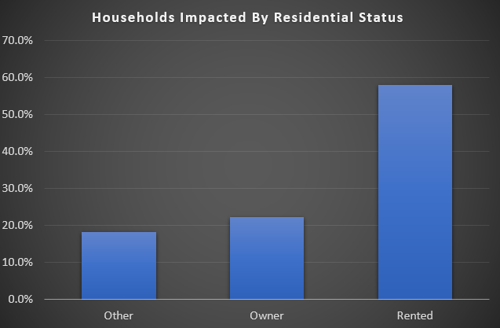
60% of households in rental accommodation have been adversely impacted, compared with 22% of property owners.
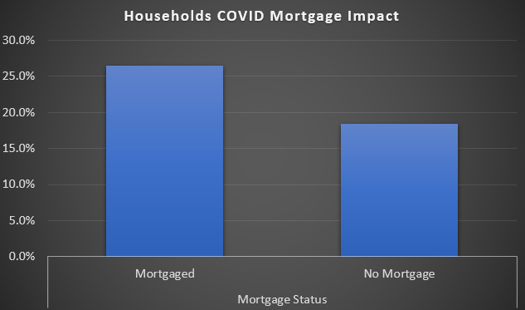
27% of those with a mortgage are impacted compared with 18% of those who are property owners without a mortgage.
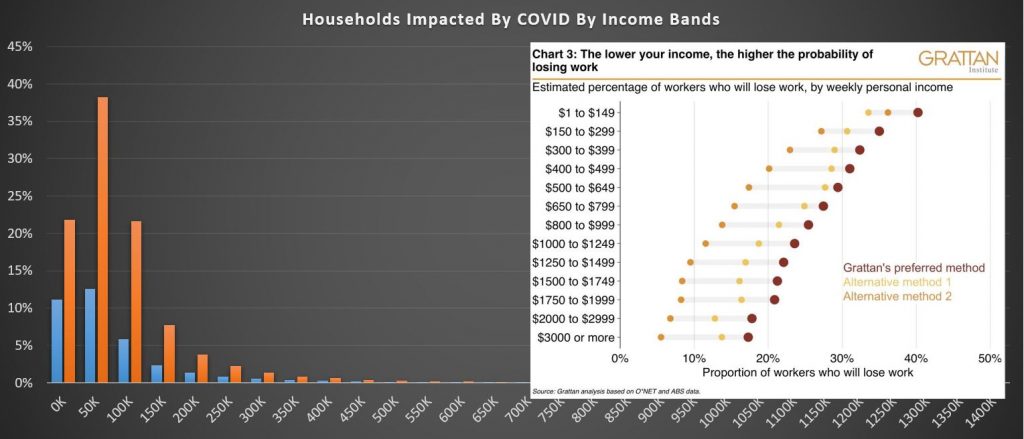
Lower income households are more adversely impacted. Half of those earning less than $50k a year and one third earning between $50-100k are impacted. This is also consistent with Grattan research. This is because many of these jobs are part-time, gig, or zero hours, and lower paid.
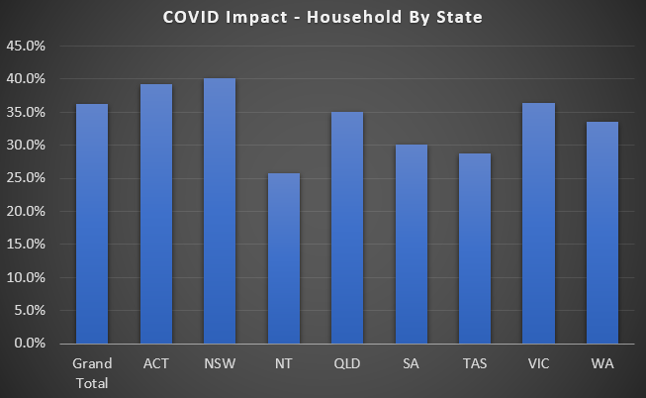
There are some state variations, with 40% of households in NSW adversely impacted, compared with 26% in NT. 35% of households in QLD and 37% in VIC are hit, and ACT was above WA, just.
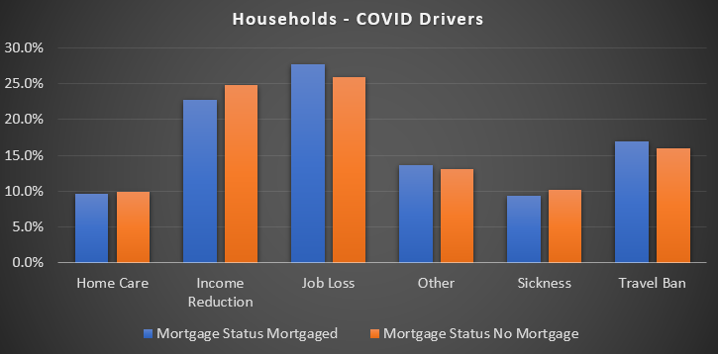
When we examine the nature of the impact, we found that job losses were driving more than 25% of those with a mortgage, followed by income reduction due to less hours, or less pay. There were some differences between those holding a mortgage and those not (though at the margin).
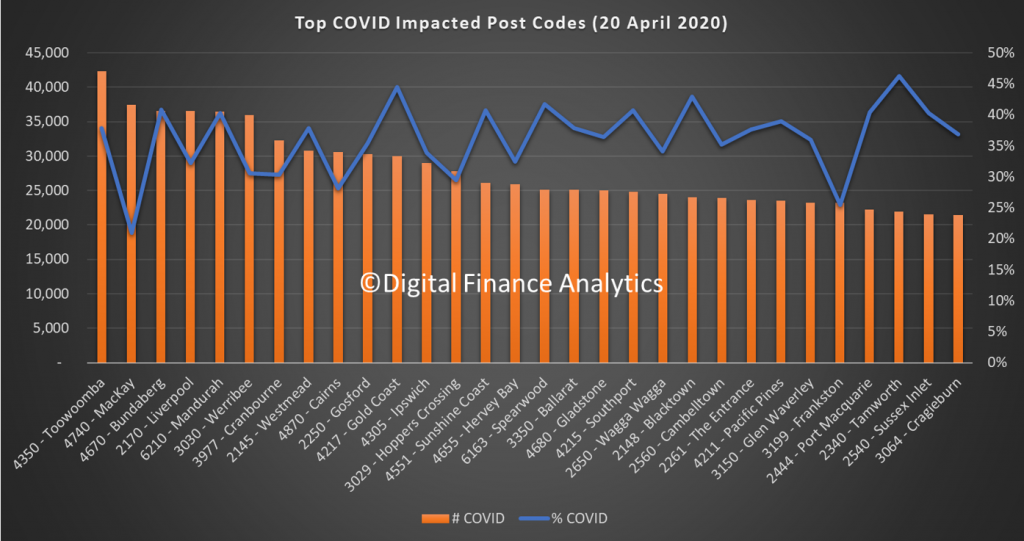
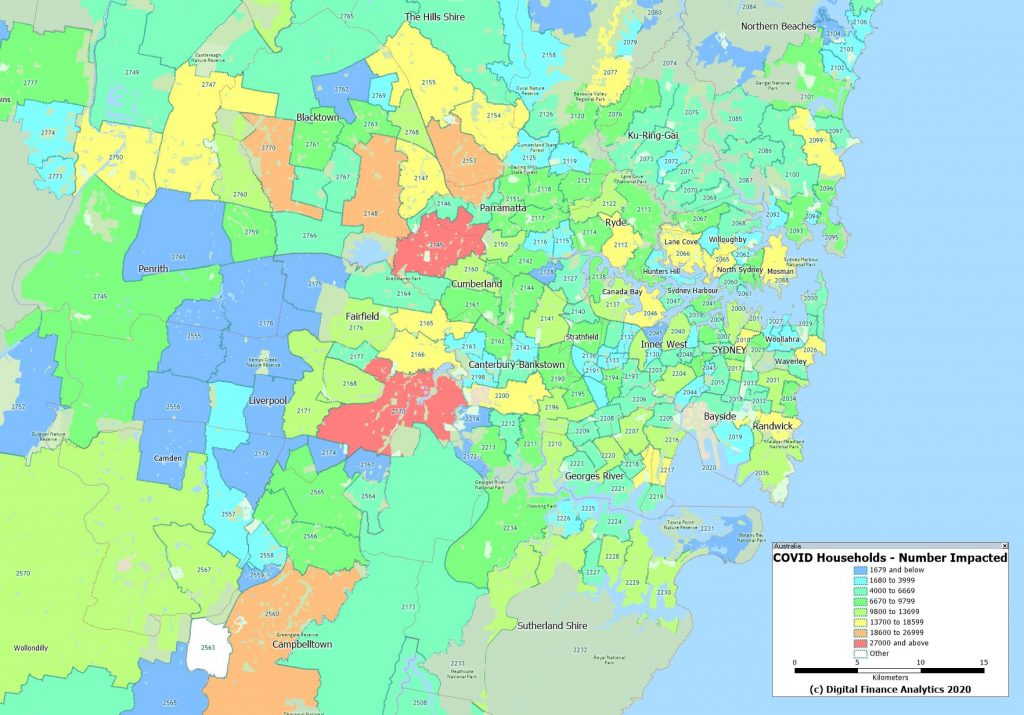
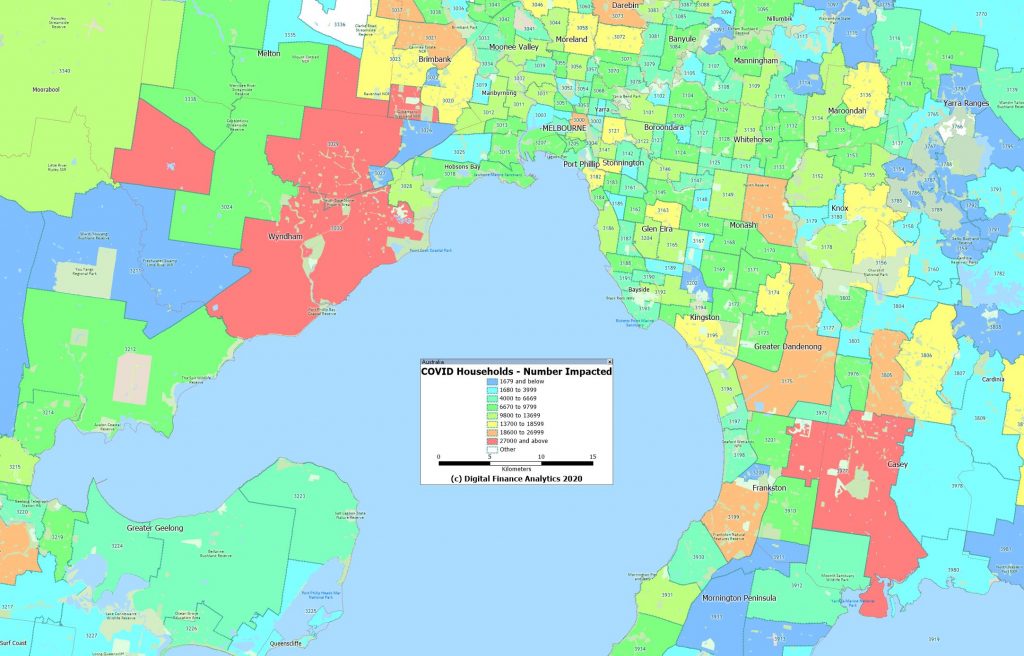
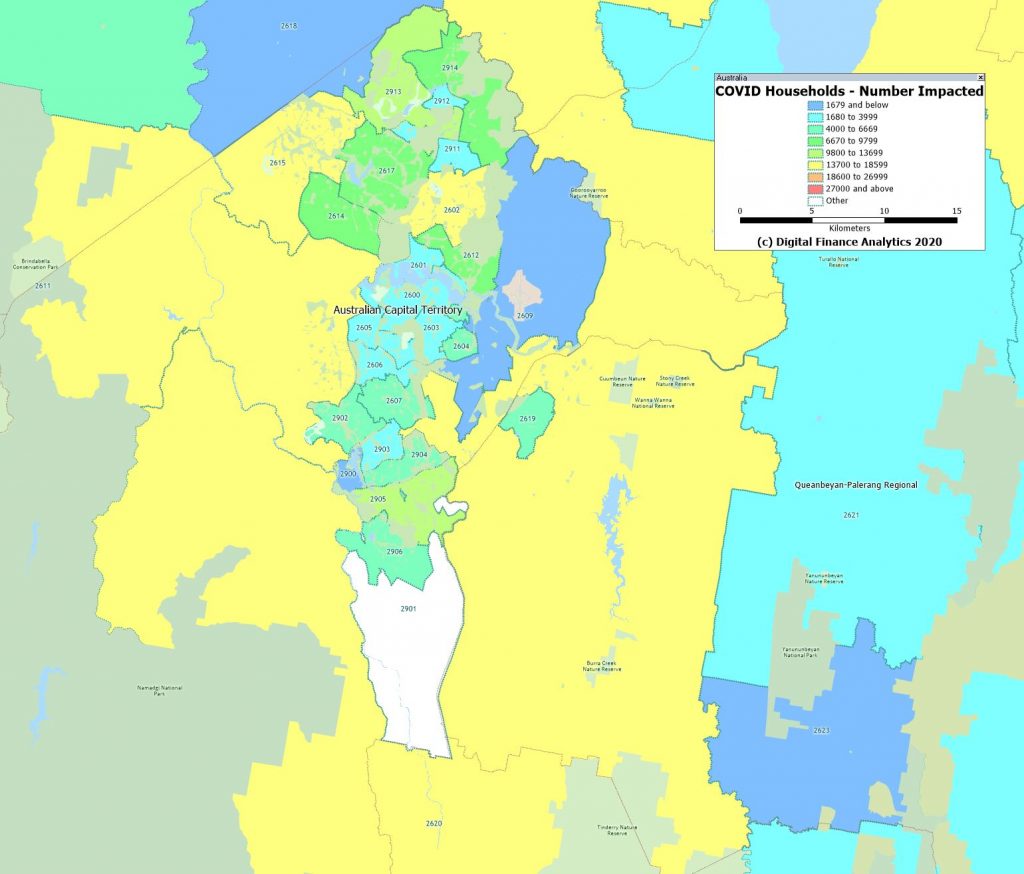
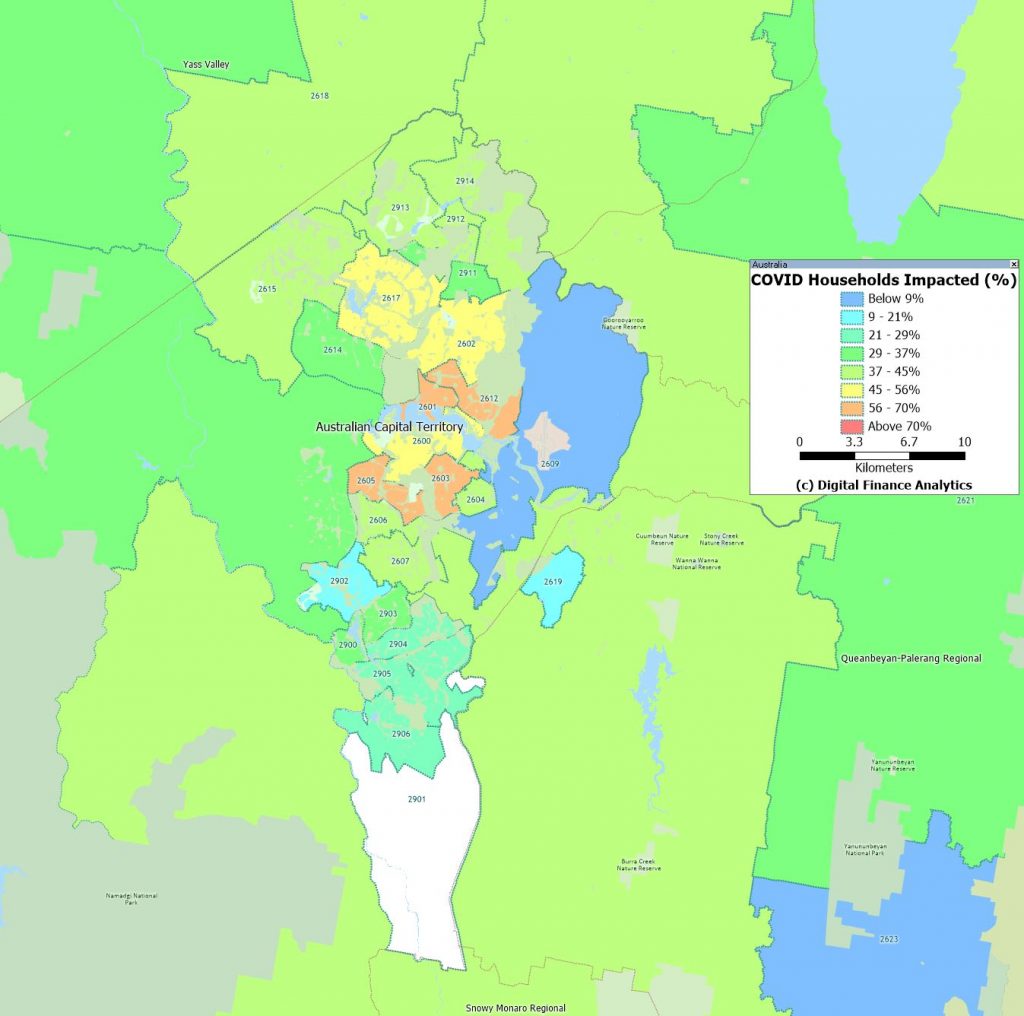
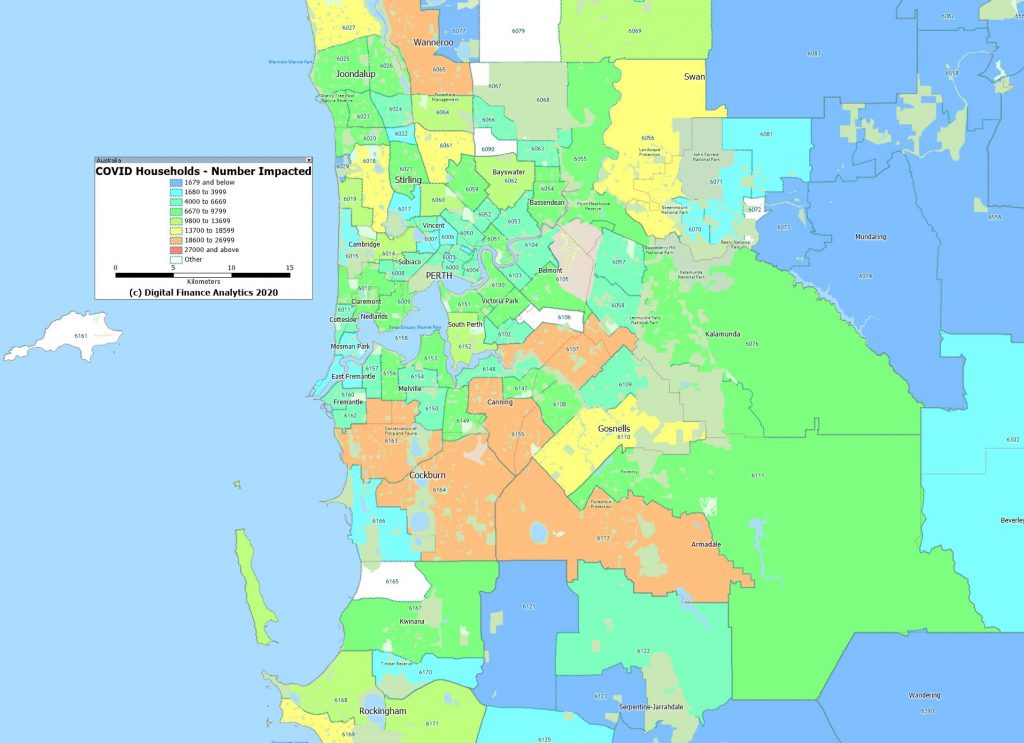
Because of the nature of the DFA survey, which is run to a post code level, we were able to identify those post codes with the largest counts of households impacted by COVID, financially speaking. We found that Toowoomba 4350 has the largest number of households impacted in the country, followed by Mackay 4740, Bundaberg 4670, Liverpool 2170, Mandurah 6210, Werribee 3030 and Cranbourne 3977. This underscores that COVID is hitting household finances areas across the country, not just in the main urban centres. Or to put it another way, even areas with low infection rates are being severely financially impacted.
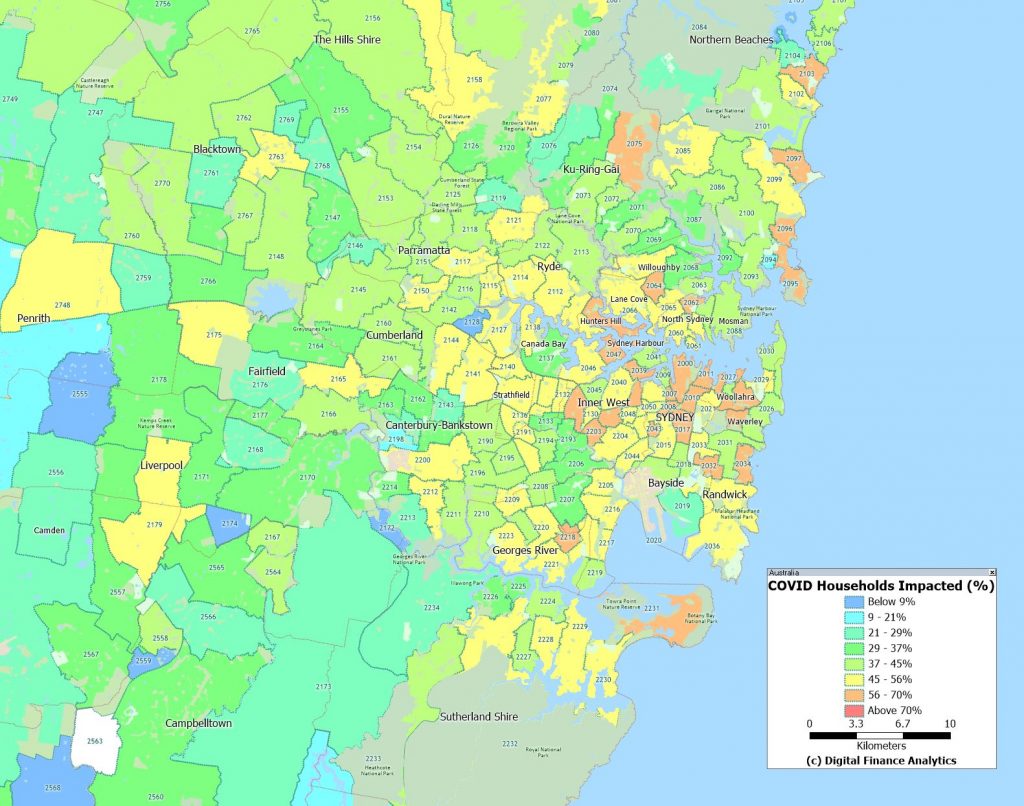
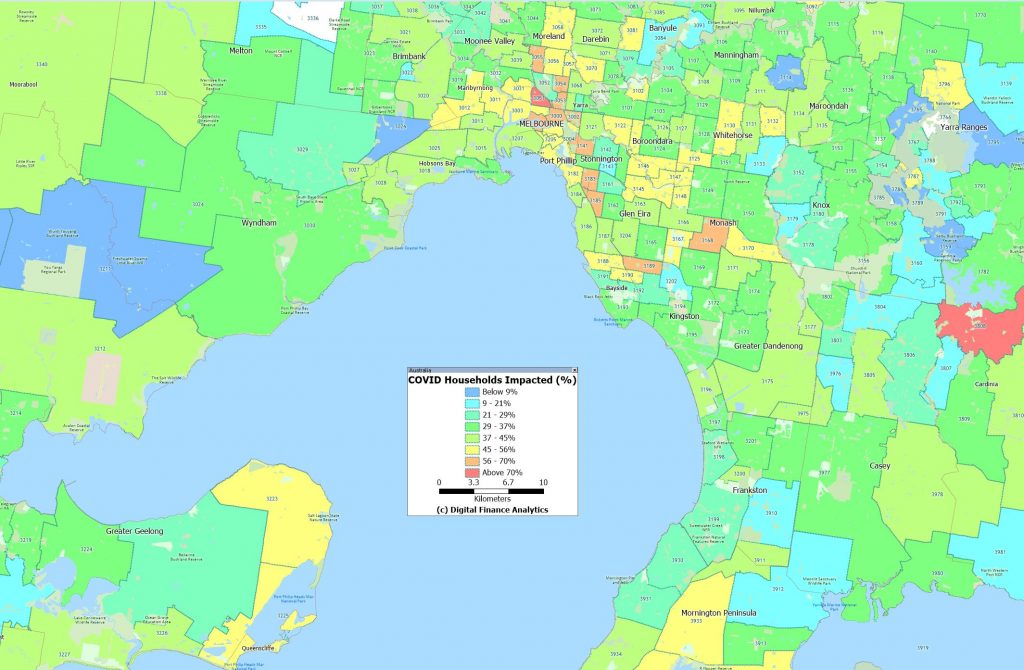
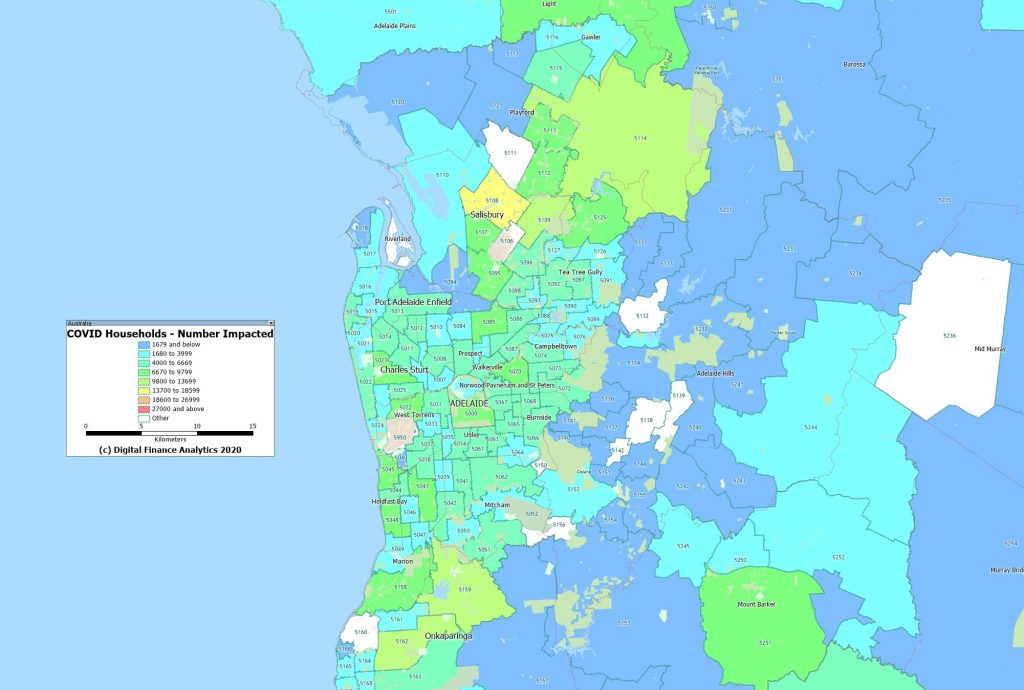
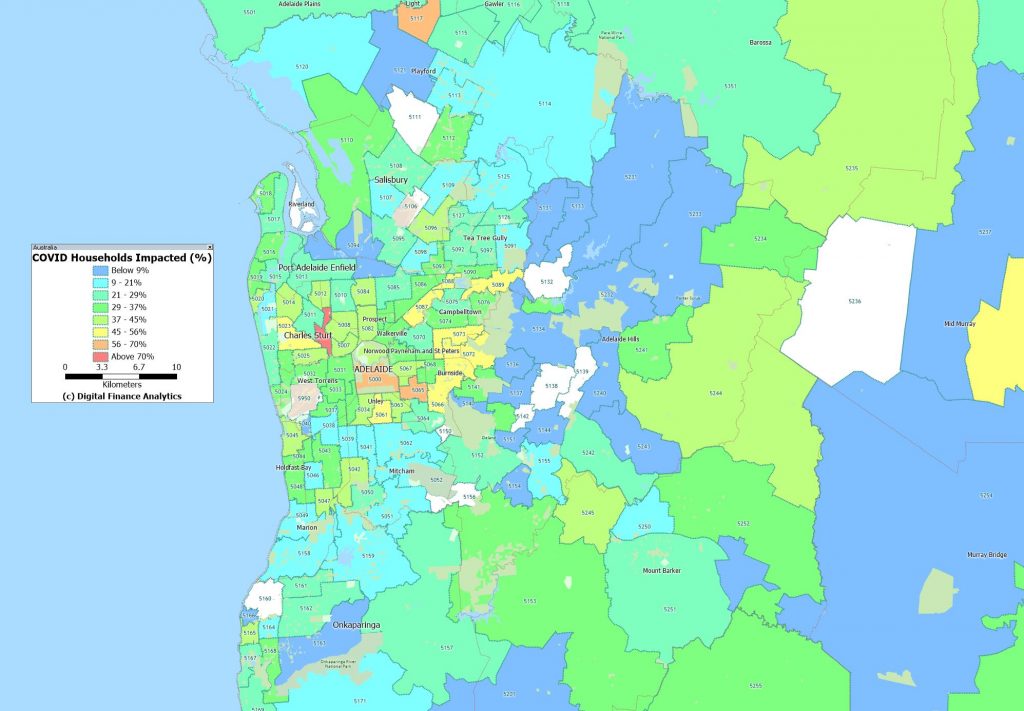
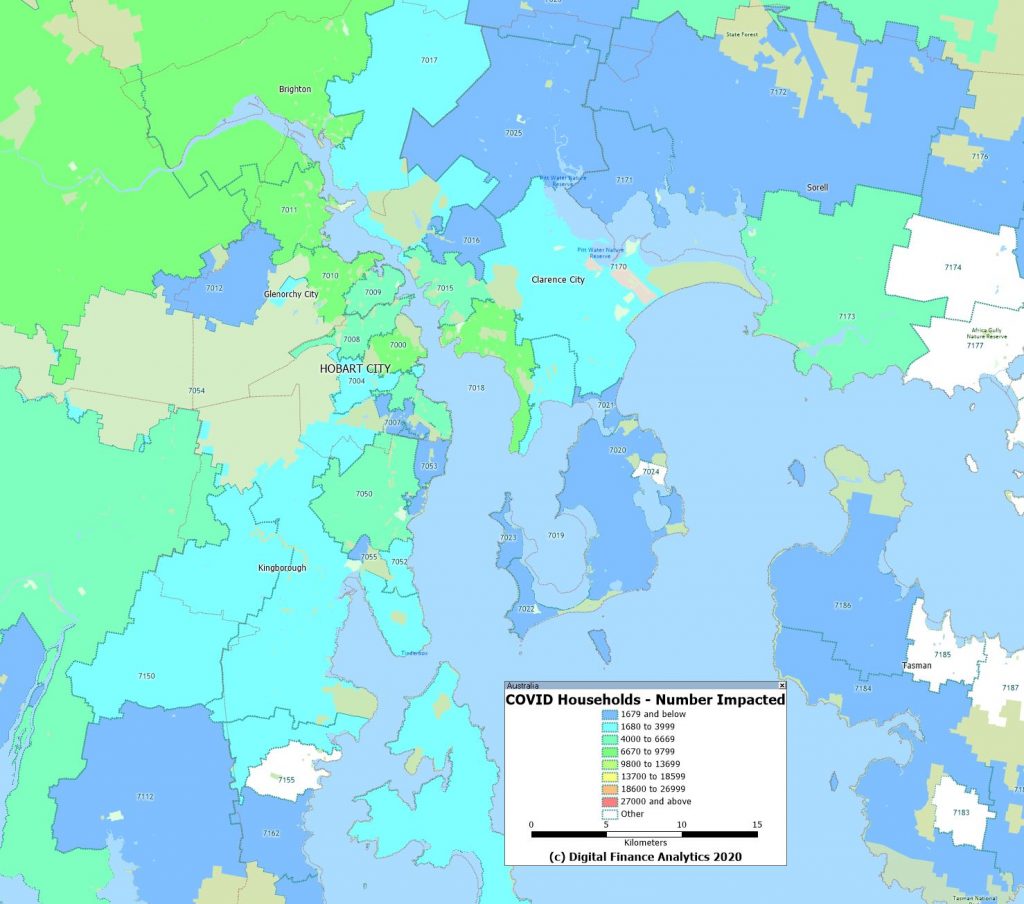
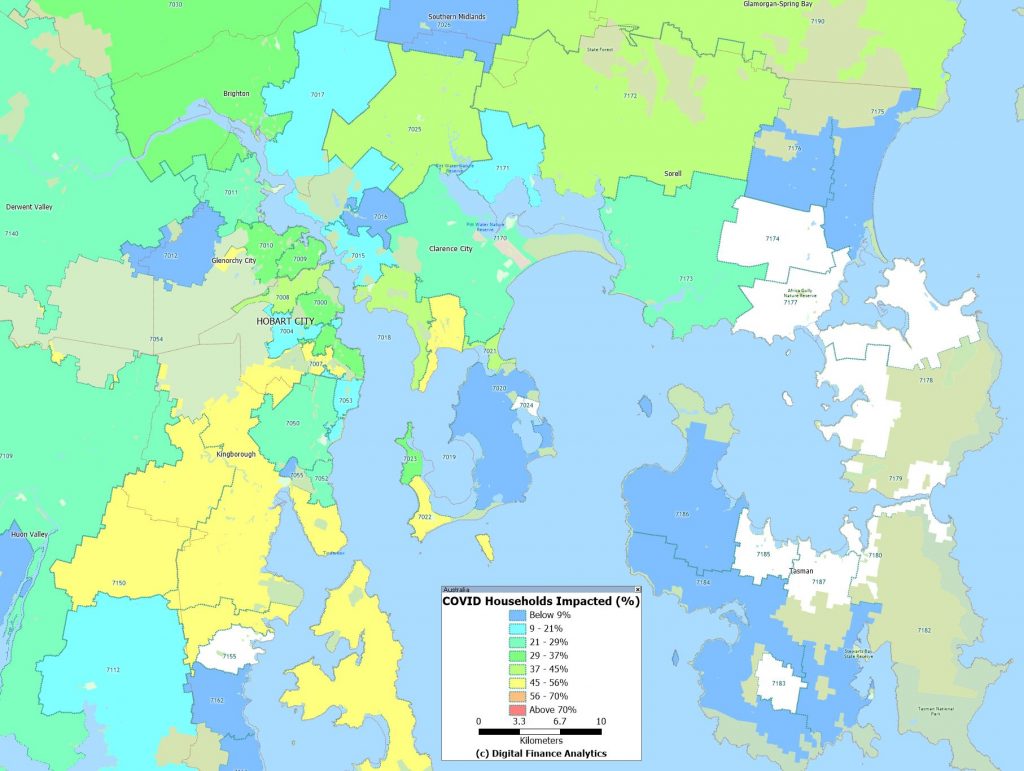
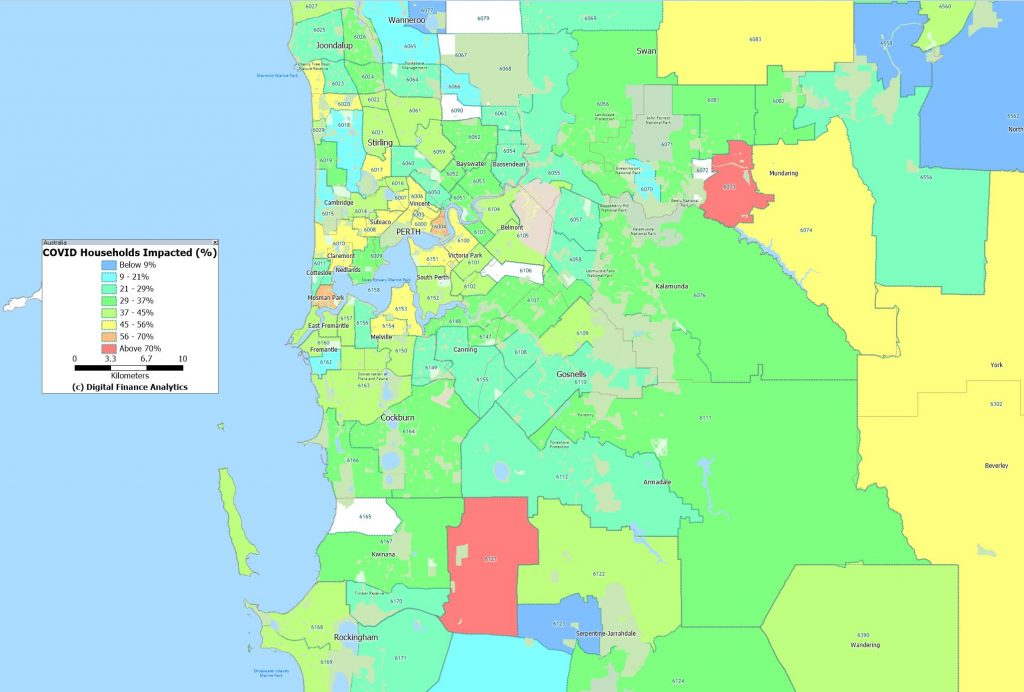
We have mapped both the number of households in each post code, and the percentage of households in each post code adversely impacted financially. There are some important differences. For example, in Sydney, post codes in western Sydney have higher absolute counts, but the relative proportion of households hit is higher in the more affluent eastern suburbs, despite having lower densities.
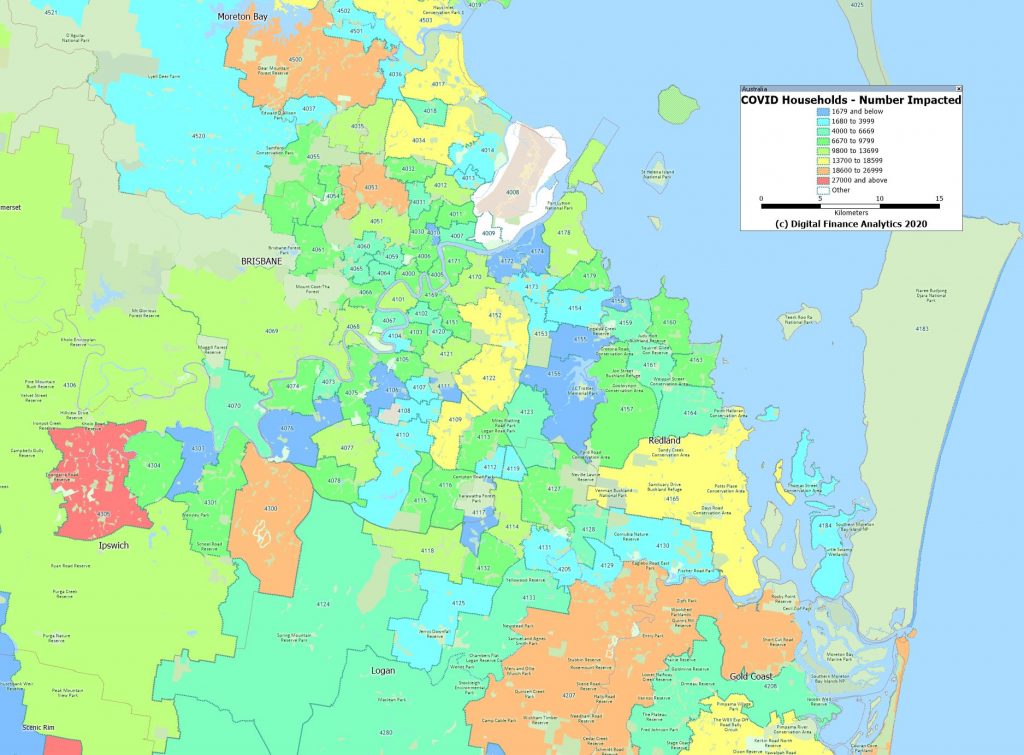
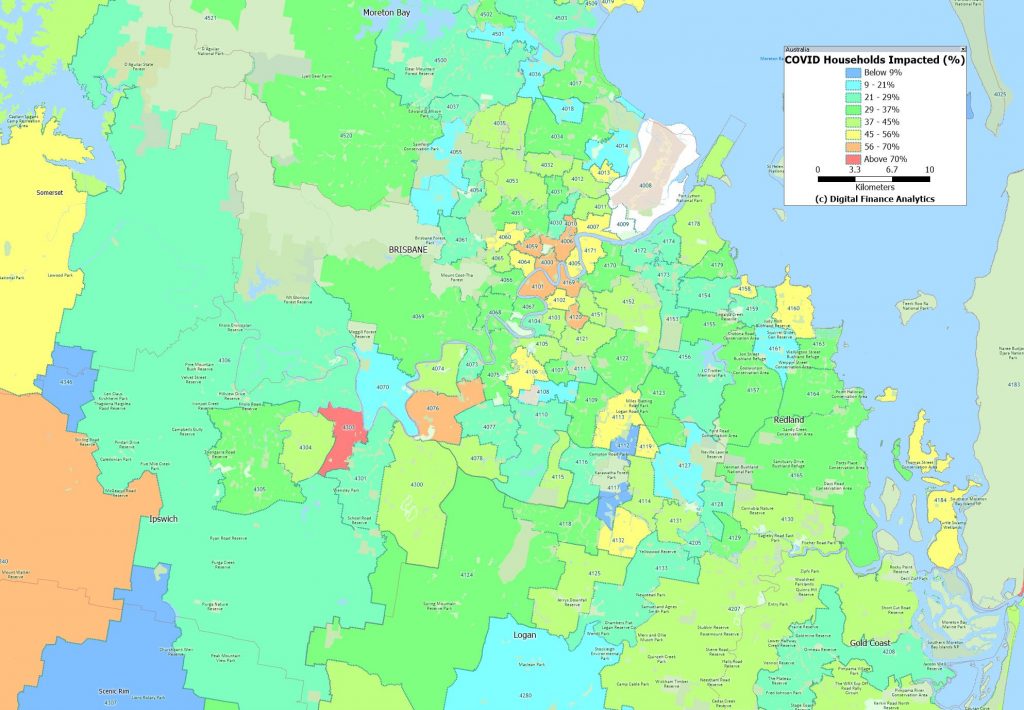
We completed similar mapping for the other major centres. Brisbane
David Llewellyn-Smith is Chief Strategist at the MB Fund and MB Super. David is the founding publisher and editor of MacroBusiness and was the founding publisher and global economy editor of The Diplomat, the Asia Pacific’s leading geo-politics and economics portal.
He is also a former gold trader and economic commentator at The Sydney Morning Herald, The Age, the ABC and Business Spectator. He is the co-author of The Great Crash of 2008 with Ross Garnaut and was the editor of the second Garnaut Climate Change Review.