
The ABS is out with September quarter inflation and it’s come in luke warm:
SEPTEMBER KEY FIGURES
|
Jun Qtr 2016 to Sep Qtr 2016 |
Sep Qtr 2015 to Sep Qtr 2016 | ||
| Weighted average of eight capital cities |
% change |
% change | |
|
| |||
| All groups CPI |
0.7 |
1.3 | |
| Food and non-alcoholic beverages |
1.7 |
1.5 | |
| Alcohol and tobacco |
1.1 |
5.7 | |
| Clothing and footwear |
0.3 |
1.2 | |
| Housing |
1.0 |
1.8 | |
| Furnishings, household equipment and services |
1.1 |
1.9 | |
| Health |
-0.2 |
3.9 | |
| Transport |
-0.5 |
-3.4 | |
| Communication |
-2.3 |
-7.5 | |
| Recreation and culture |
0.6 |
0.6 | |
| Education |
0.2 |
3.3 | |
| Insurance and financial services |
0.9 |
2.9 | |
| CPI analytical series | |||
| All groups CPI, seasonally adjusted |
0.4 |
1.4 | |
| Trimmed mean |
0.4 |
1.7 | |
| Weighted median |
0.3 |
1.3 | |
|
| |||
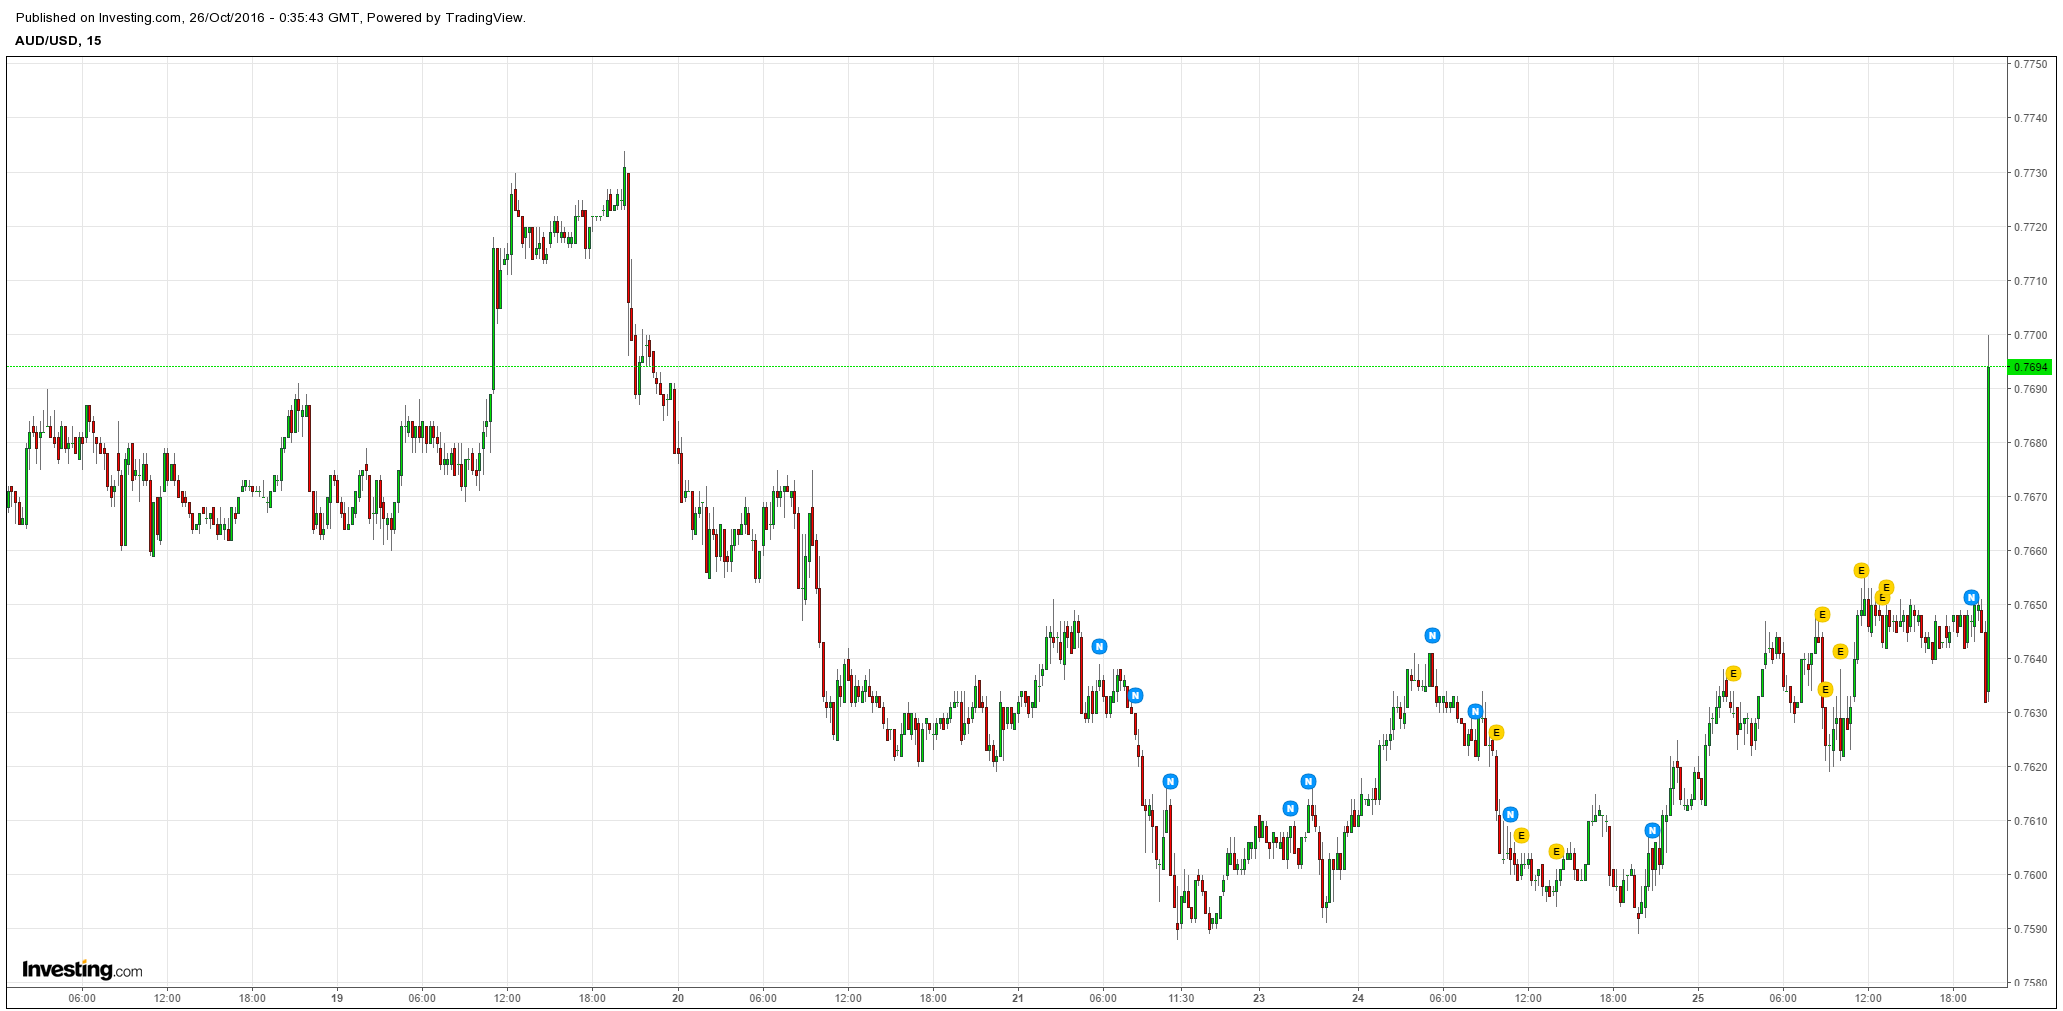
Headline was a bit up on expectations but analytical measures were right on and a bit weaker. Dollar to the moon just because:
Advertisement
More to come.
