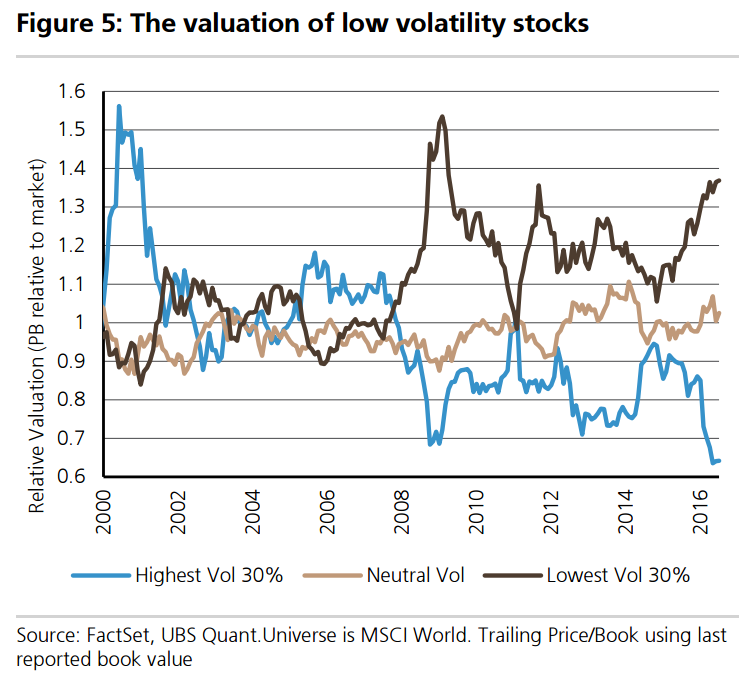
Conventional wisdom defines a bubble as any asset driven by ‘irrational exuberance’ that exhibits valuations that have drifted significantly from their long term valuations. In this paper, we think of valuation as a function of expected growth and risk premia. In theory, bubbles perpetuate themselves due to the business risk of asset managers. Thismotivates institutional herding and rational ‘bubble-riding’. So where are the bubbles right now? Given a world of structurally low growth and low inflation, we expect bond yields and hence earnings yields on the market to remain at lower levels compared with their long term history. However, we identify two key areas that may be overvalued. Firstly, equities in general are trading at very high multiples, which makes sense given the level of bond yields, however, this doesn’t appear to be pricing the level of macro risk that we’re witnessing in the market. Secondly, low volatility equities are trading at significantly higher multiples relative to the market. These stocks tend to have higher levels of gearing and as such carry a higher beta to credit markets. If this is indeed the end of the credit cycle (as Matthew Mish points out), we believe low volatility stocks that are highly geared are likely to underperform.
What causes markets to crash?
In order to predict corrections or ‘crashes’, we need to understand the investment cycle. Bubbles tend to form during periods of excess liquidity. As a consequence, valuations become stretched and perpetuated through ‘rational bubble riding’. However, eventually the competitive landscape increases and costs pressures build, placing pressure on margins and squeezing earnings. At this stage, credit becomes more challenging to raise as lenders (witnessing the tighter environment) increase lending standards. As a consequence, credit spreads increase and place further pressure on company earnings. The net result is the end of the earnings cycle. As earnings come under pressure, the stock market starts to drift lower and multiples begin to compress. It’s at this point that the risk of a market correction increases. We make the distinction between a market downturn or ‘Bear Market’ and a stock market ‘Crash’ as the two have different drivers. A market downturn is driven by the credit and earnings cycle, whilst a stock market crash is a liquidity event.
Where are we in the cycle and where is the risk?
We are currently witnessing the end of the credit cycle. Credit spreads have been increasing, global earnings growth rates are in aggregate flat and market impact has been increasing. Market impact is currently running at 80bps across developed markets, a level that tends to be commensurate with negative returns and an elevated risk of correction. The risk today, oddly is in so-called ‘low risk’ assets. We show that low volatility assets are generally more highly geared than higher volatility stocks. As a consequence, they tend to have a high residual beta to credit. As lending standards tighten and credit spreads increase, it is likely that highly geared stocks underperform regardless of their volatility.
What should we own right now?
We like High Quality stocks with improving fundamentals and sustainable levels of gearing. Key picks are: Alphabet Inc, Nestle S.A., NTT DoCoMo Inc, China Mobile Ltd, and Amcor Ltd.
David Llewellyn-Smith is Chief Strategist at the MB Fund and MB Super. David is the founding publisher and editor of MacroBusiness and was the founding publisher and global economy editor of The Diplomat, the Asia Pacific’s leading geo-politics and economics portal.
He is also a former gold trader and economic commentator at The Sydney Morning Herald, The Age, the ABC and Business Spectator. He is the co-author of The Great Crash of 2008 with Ross Garnaut and was the editor of the second Garnaut Climate Change Review.