Chris Weston, Chief Market Strategist at IG Markets
AUD/USD – the trading playbook
The AUD is the second worst performing currency in G10 FX in 2016, although there has been a clear change of fortune since the April highs of $0.7835. There has been somewhat of a perfect storm for AUD depreciation, but the point of debate is whether there is further downside from here. With this in mind, it is important to take a multi-dimensional view – assessing economics, market positioning, the technical set-up and market pricing (around monetary policy) to assess the highest probable move.
The findings largely point to further downside, with the base case being that AUD/USD trades below 70c in the coming months. With this view in mind, here are the key considerations for price discovery:
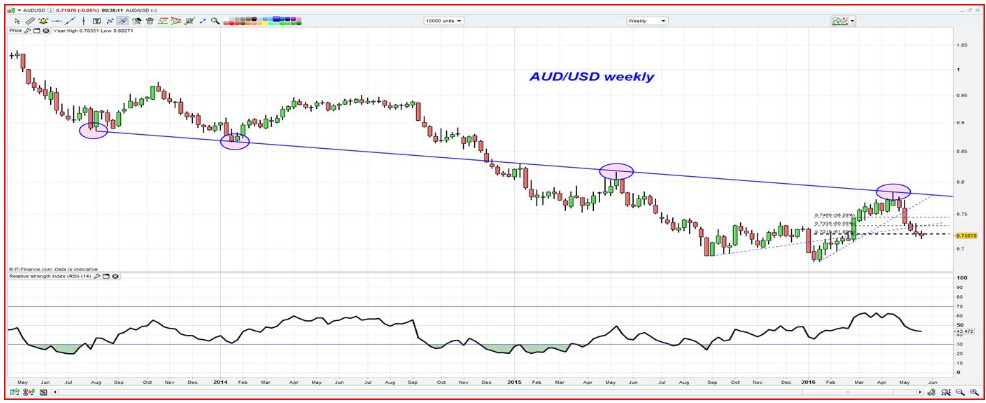
Technical overview – The trend is lower and a weekly close below $0.7212 provides a sell signal.
Economic backdrop – All eyes on Australian Q1 GDP (1 June) and Q2 CPI (29 July). Janet Yellen’s speech on 6 June is also key. Economics suggest USD appreciation.
Positioning – The speculative community is still long AUD. A modest AUD negative.
Fundamental drivers – Looking at a simply AUS/US bond yield spread suggests downside risks for AUD/USD.
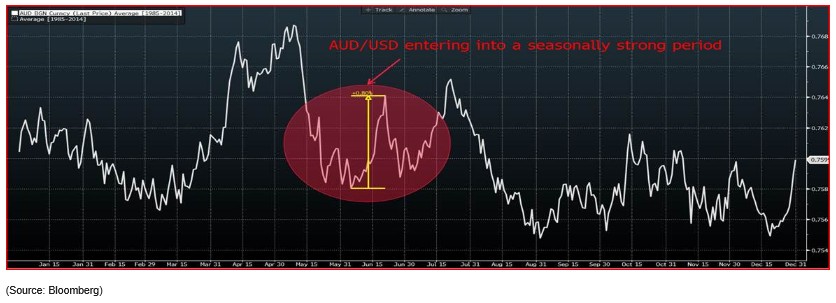
Seasonal factors – AUD/USD is entering a seasonally strong period. A modest AUD positive.
Technical overview
Weekly chart – We saw a clear rejection of the 2013 former downtrend in April (circled) that has ultimately led to AUD/USD trading through the 61.8% retracement of the January to April rally at $0.7212. The pair has closed through this level on the daily chart, but a weekly close through $0.7212 would have much more meaning and would be the trigger for fresh short positions, putting $0.7000 in play. Price has also closed through the bottom of the weekly ichimoku cloud (at $0.7270). On the weekly chart, the balance of probability suggests lower levels are likely in the short- to medium-term.
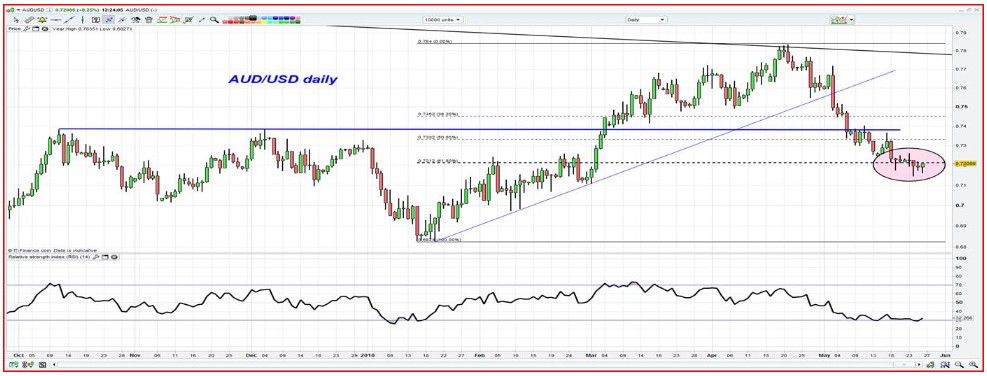
Daily chart – On a shorter time frame, we can see price is consolidating after an 8% decline since the 21 April high. Price action is less convincing of late, with better buying coming into the pair below $0.7200. Importantly, there are no signs of divergence between price and the various oscillators, so there seems limited reasons to be long with any conviction, especially as the trend is clearly lower. From a pure price action perspective, traders seem to be waiting for fresh news.
AUD/JPY should also firmly be on the radar and a weekly close through ¥79.00 would suggest a resumption of the downtrend.
Economic background
The Reserve Bank of Australia (RBA) cut rates in the May meeting and subsequently lowered its estimate for core inflation to a range of 1-2% by December in the Statement on Monetary Policy, with the market responding in kind. There currently seems little in the way of price pressures, with a clear moderation in non-tradeable CPI inflation since Q3 2015. Domestic wage growth fell to 0.4% quarter-on-quarter in Q1 (a record low), which has backed the RBA’s stance about ‘very subdued’ wage growth. Full-time employment is looking shaky and the unemployment rate seems to be supported largely by falling participation rate.
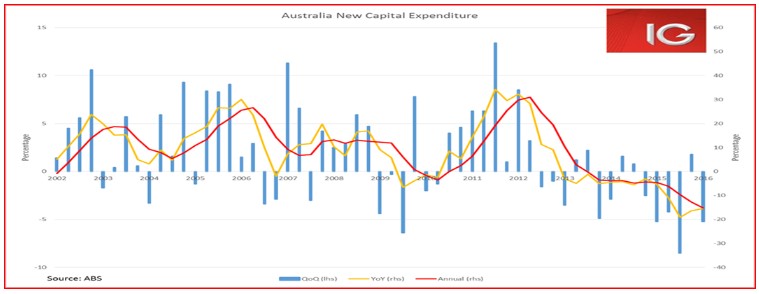
Since April, the speculative community has reduced its significantly (see positioning considerations) long AUD position. However, there has been a collapse in Australia’s key terms of trade and a broad-based strengthening of the USD, so it’s no surprise that the AUD/USD has fallen 6.5% and trade-weighted AUD 3.3%. Outgoing RBA governor Glenn Stevens chose not to push back on market expectations of easing on 24 May, and this has supported the belief that we will see a further 34 basis points of cuts (over the coming 12 months). Today’s 5.2% decline in Q1 business investment will only subtract from next week’s Q1 GDP (consensus +2.6 year-on-year), although it was positive to see investment intensions (second estimate) for 2016 /17 being revised up 6.3% to $89.2 billion.
Further cuts are coming, the question markets are trying to assess is whether they fully discounted into the rates market and whether the AUD has got further downside from here?
Market pricing around further rate cuts
Looking at the swaps (OIS) market, we can see that a further 25 basis point cut in August from the Reserve Bank is a line ball call. The bulk of economists are calling for the cut, but we should get a clearer indication after next week’s Q1 GDP data and, most importantly, the Q2 CPI print on 27 July. We also have a couple of employment reports, while housing data from the capital cities is always a key input. It’s clear that the heat seems to have come out of the housing market.
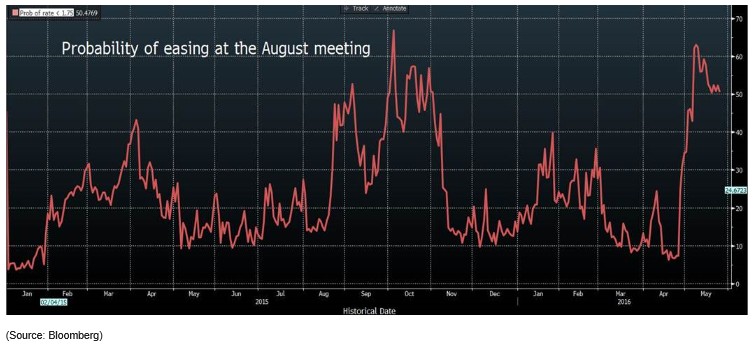
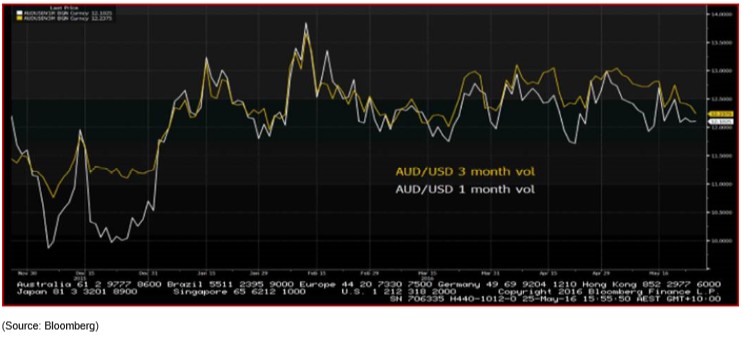
It’s interesting that while the August meeting is a ‘live’ meeting and could go either way, implied three-month options volatility is fairly subdued. Traders are therefore not expecting fireworks, but this is something worth watching, as the prospect of implied volatility increasing is high. Naturally, this is a key consideration for risk management, but as things stand, the market has been happy to sell volatility Although, this is likely to reverse as we focus away from Fed policy and back towards potential RBA easing in late July.
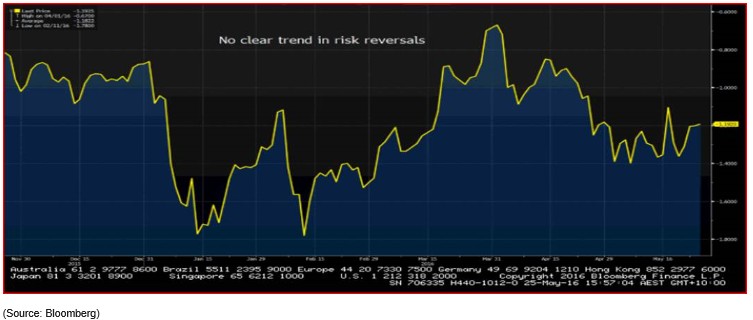
The lack of implied volatility is also mirrored in risk reversals (‘risk reversals’ provide an indication of demand for put options relative to calls and are a good indication of sentiment). We can see that traders have been covering hedges against further AUD/USD downside of late, which also seems reflected in the daily chart.
Traders moving towards the Fed’s view on tightening
Of course, we also need to take a view on Fed policy. Looking at the Fed funds futures pricing, the market is currently pricing a 68% probability of a hike by the July meeting and 86% for the September meeting. Looking at the January Fed funds contract, we can see that 31 basis points (bp) of tightening is priced in for December. So not only is one 25 bp hike fully discounted by year-end, but there is a 24% chance of a second. This seems fair.
The Fed have clearly guided the market to increase its implied probability, but US data has certainly improved over the last few weeks and Q2 GDP (released 29 July) should improve to around 2.4% year-on-year. Traders need to focus on Janet Yellen’s speech on 6 June (7 June AEST at 02:30) for confirmation that market pricing is correct. Given the rally in the trade-weighted USD, there is a growing risk we see a ‘buy the rumour, sell the fact’ scenario play out (in the USD), so this must be a key consideration closer to the time.
Positioning
Focusing on the weekly Commitment of Traders report (CoT), non-commercial accounts (the speculative trading community) have cut back on AUD long positions, which were at the highest in April since 2013. For background, every Tuesday futures traders have to report their gross long and short positons and the CFTC (Commodity Futures Trading Commission) then publishes the net position to the market on the Friday. This gives us a guide to how the fast money are positioned.
Importantly, speculative funds are still net long AUDs, which is also true of asset managers. So from a pure positioning perspective, there is clear scope for the AUD to trade below 70c. Positioning could even go deeply negative like we saw between September to November, if we see a sharp pick up in market volatility that encourages an unwinding of carry structures.
AUD futures positioning – white histogram, AUD/USD – red line
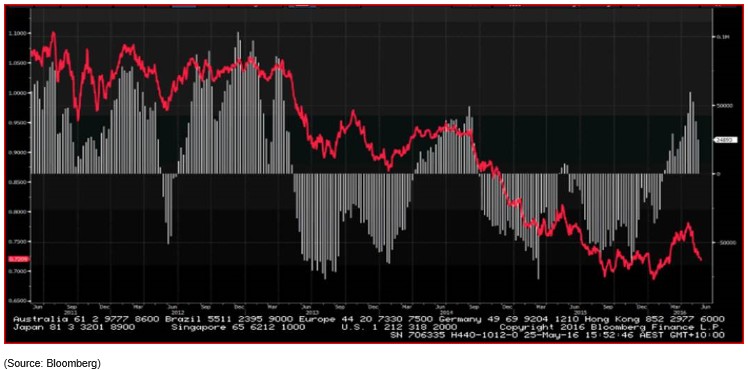
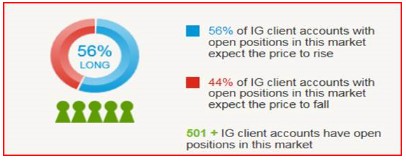
Our own internal client flow is now far more nuanced and two-way, with 56% of all open positions held on the long side. This sentiment seems very fitting with price action, which as detailed on the daily chart technicals, is seeing signs of greater indecision.
Fundamental drivers
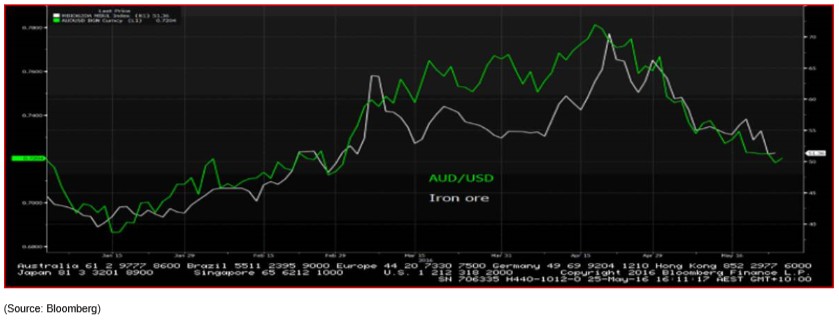
AUD/USD (green line) vs iron ore (white line) – The correlation is a core consideration for traders, although the 20-day rolling correlation has fallen from 0.69 (or 69%) in late April to stand at 0.5.
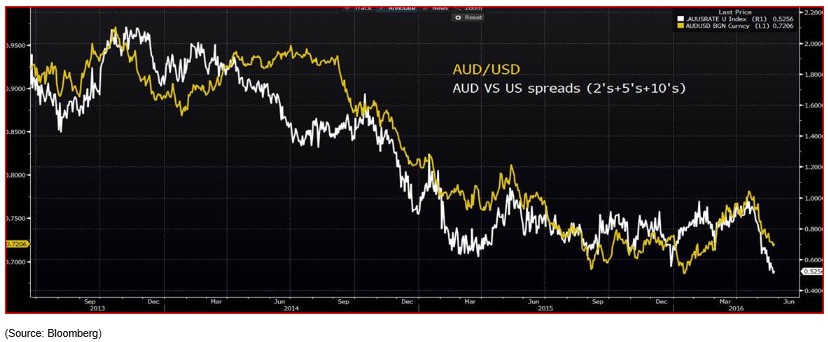
AUD/USD (yellow line) vs AUS/US bond yield spread (white line) – Using the fixed income market as a basic guide to short-term valuation, we can see that there are still downside risks to AUD/USD. Rather than take one part of the fixed income curve, one can take a combination of maturities and looked at the aggregated differential between Australian and US treasuries.
Here we can see that the aggregated premium commanded by fixed income investors for Aussie government bonds has fallen quite dramatically against US treasuries. This in turn has removed much of the yield (or valuation) support for AUDs.
Seasonal factors
The Bloomberg chart blends the past 30 years of data (until 2015) and shows the average moves over the period. Clearly, this is not a factor one would trade off in isolation, but it is interesting AUD/USD is coming into a fairly strong period. The average returns for holding AUD/USD longs through June is close to 0.8%, although clearly the March to April period is really the time to see AUD appreciation.