Chris Weston, Chief Market Strategist at IG Markets
Clearly traders had warmed to the Bloomberg article (22 April) centering on offering liquidity to Japanese banks and effectively paying them in the process. This speculation started from a belief that we were going to get aggressive broad based easing, hence the aggressive reaction. In fact, we heard a definitive argument not to increase asset purchases (the vote was 8 to 1) and in governor Kuroda’s press conference he mentioned that paying banks to take liquidity (a la Bloomberg article) was not even discussed. There seems little doubt that the lack of measures will erode further investor confidence in the BoJ’s ability to achieve its inflation target. Still, there will be calls for further easing from sell-side economists in the June meeting and ahead of the July Upper House elections.
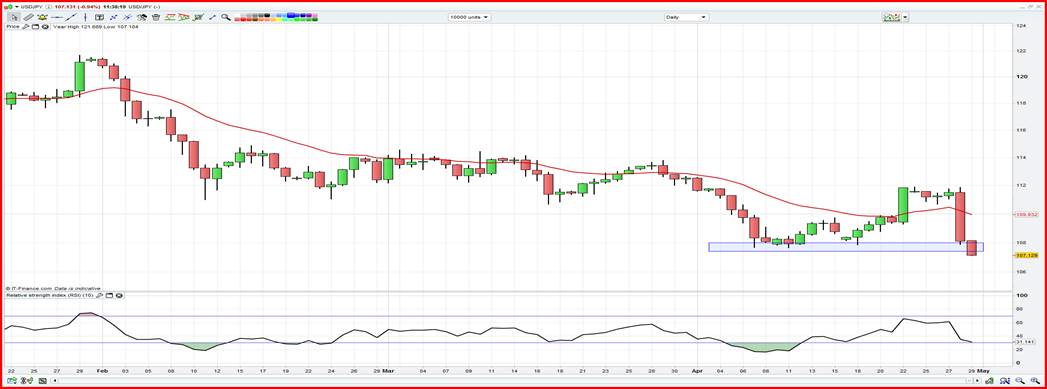
If we throw in a US Q1 real GDP rate at 0.5% (last night) and you have a weaker USD as well with the interest rate market pricing a 14% chance of a June rate hike and 82% by the December. USD/JPY has broken below ¥107.66 (7 April low), thanks largely to a massive CNY fix from the PBoC. A daily close will lead to ¥105.20 (October lows). This level is key, watch the break here.
For those who follow longer-term FX valuations and notably the purchasing power parity (PPP) contribution, ‘fair value’ on USD/JPY is closer to ¥90.00, although PPP doesn’t account for massive expansion of base money.
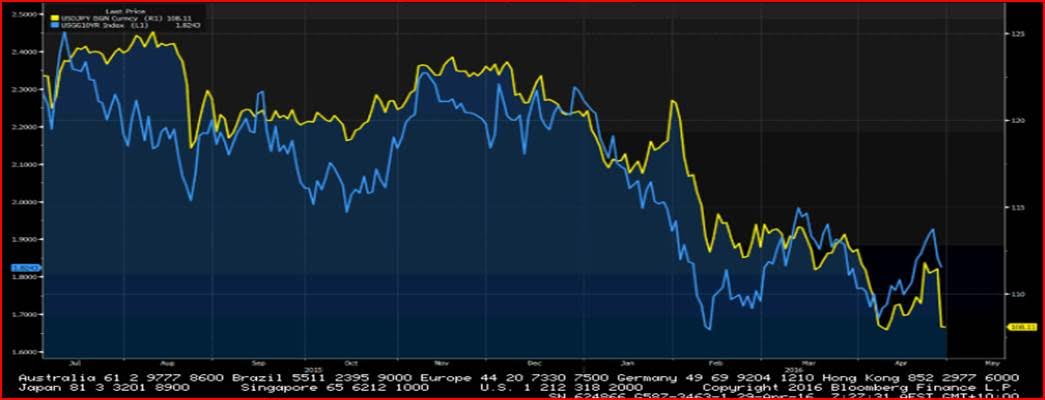
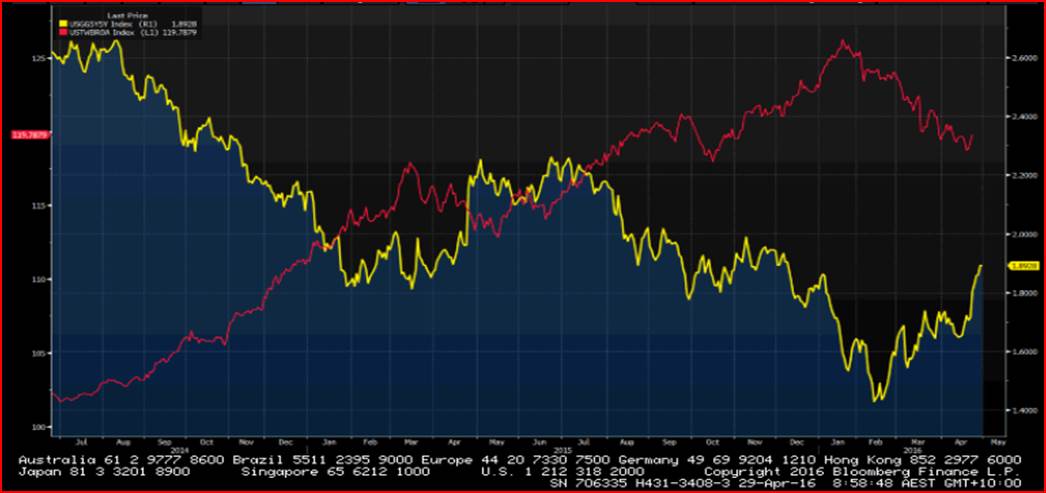
USD/JPY vs US 10 year Treasury – Clearly the move in USD/JPY we saw yesterday was aggressive (the biggest since May 2010), so going off this correlation, we can make an argument that US 10-year treasury yields have further downside (ie. higher prices).
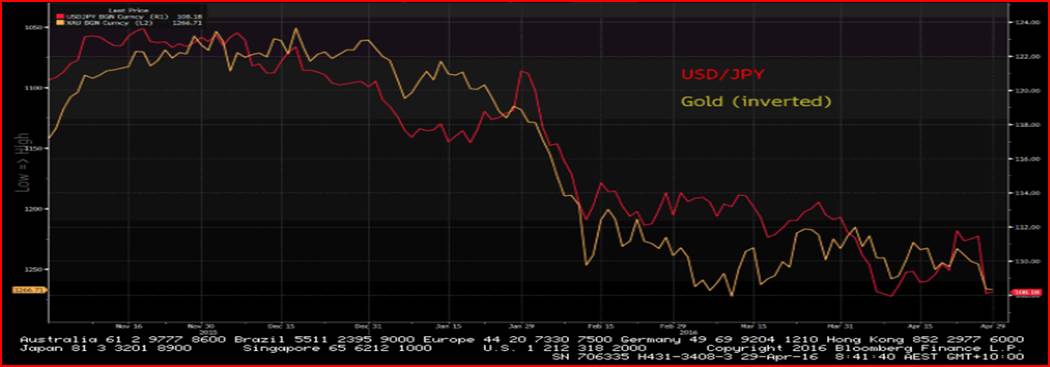
USD/JPY versus Gold (inverted to highlight correlation) – USD central to other markets
US 5-year inflation expectations (yellow line) versus Fed’s trade-weighted USD (red line) – One of my favourite charts which has so many far-reaching implications. What we can see here is as the USD falls, inflation expectations are pushing up quite aggressively. Higher inflation expectations are presumably giving gold/silver an extra bid, but the question is how much further does this dynamic have to go? Given the market is pricing in a meagre 14% chance of a hike by the June FOMC meeting, at some stage this dynamic will shift. A chart to watch, but if inflation expectations hit 2.2% then this would be a key inflection point and suggest turning markedly more bullish on the USD.
Watch March core PCE (the Fed’s preferred inflation data) tonight at 22:30. The market expects a 10 basis point drop to 1.6%, so this could influence financial markets tonight as the USD is most sensitive to inflation data.
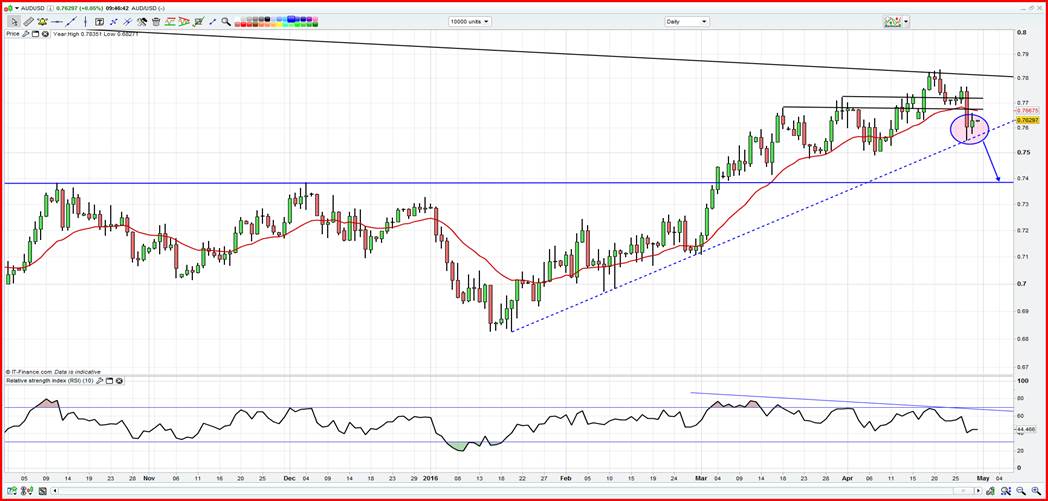
AUD/USD daily chart – Wednesday’s horrible Aussie Q1 CPI print has left the interest rate market pricing a 53.2% chance of a cut from the RBA next week. This makes for interesting trading, although if we look at AUD/USD 1 week implied volatility it’s hardly elevated at 14%. Price however has found support at the January uptrend (now at $0.7573) and I would be a seller on a closing break through here for $0.7385 (the former neckline of the double bottom). Yesterday’s 5% rally in iron ore futures is helping sentiment towards the Aussie somewhat today. Can’t really turn more bullish until the pair pushes above Wednesdays high of $0.7768.
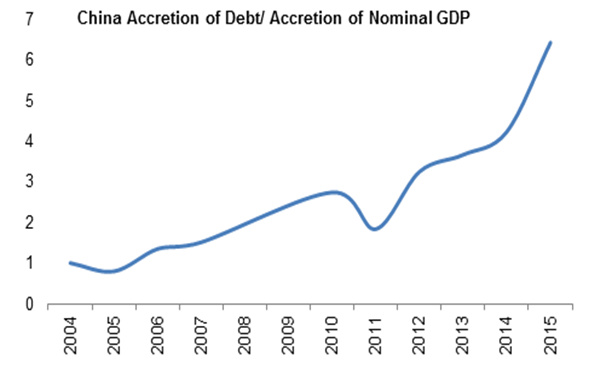
China – On a slight side-note, this chart from Morgan Stanley puts China’s credit binge into perspective. It shows the amount of USD’s of debt required to generate $1 of GDP. In a world of diminishing returns, this shows China’s growing ineffeciences.
Apple (weekly chart) – Another big drop yesterday after Carl Icahn disclosed he was drawing down part of his sizeable Apple holdings. China concerns have been cited, but clearly AAPL are missing a catalyst and the sales numbers out of China are a growing concern. Support is seen at $94.78 (the 50% retracement of the 2013 to 2015 rally) and a weekly close below here and subsequently the 200-week average at $93.99 and we could be staring at a $70-$80 company over the medium-term. Always tough to short AAPL in anticipation of a new iPhone, but price at present is looking remarkable vulnerable. I’d rather be in Facebook or Amazon, but Apple could have greater reaching implications, given it is a quasi-macro play (think exposure to China and USD headwinds).
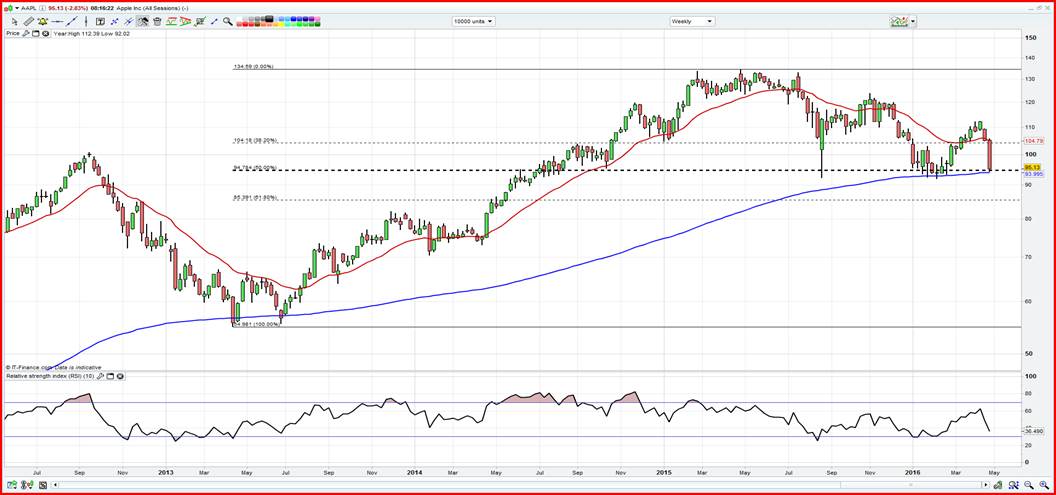
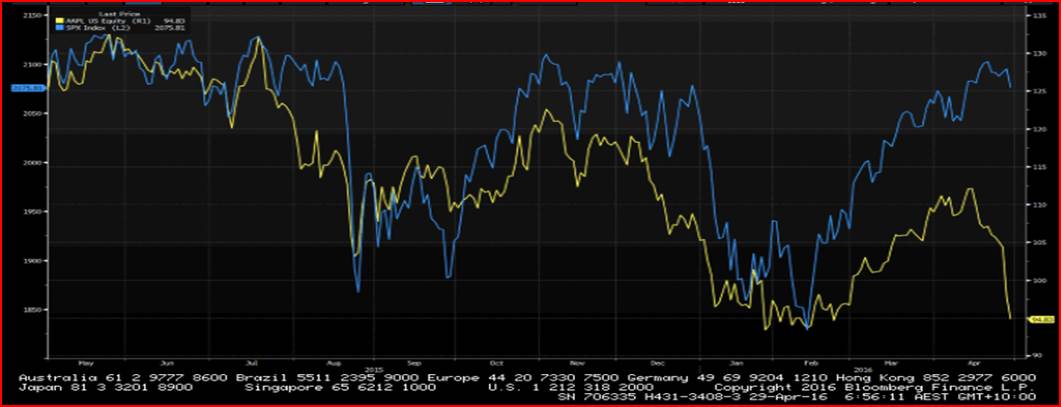
Apple (yellow line) vs S&P 500 (blue line) – We used to say ‘as goes Apple, as goes the S&P 500’. This has diverged somewhat in the last month, but it’s worth keeping an eye on. A close below $93.99 and there’s a good chance the S&P 500 will start accelerating to the downside.
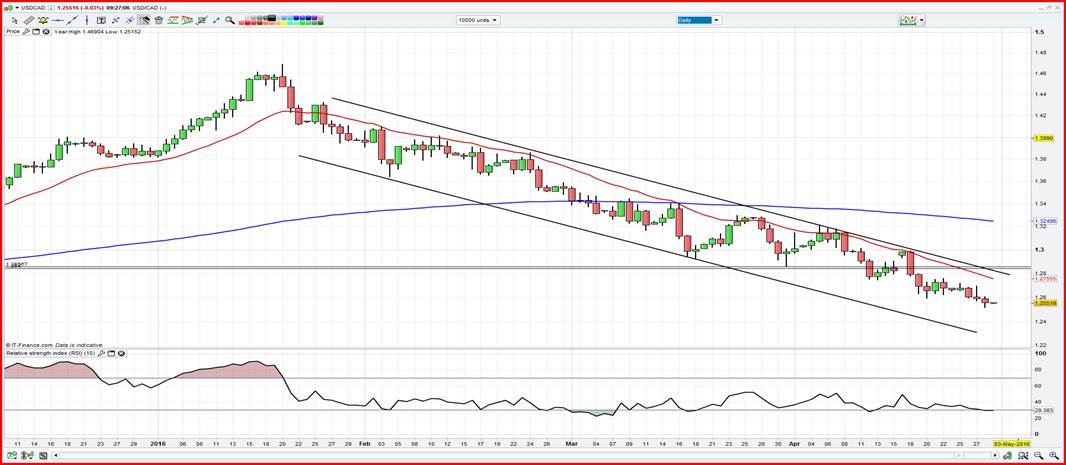
Trade of the day – Short USD/CAD into $1.2625, stop loss at $1.2780. Targeting $1.2400.
USD/CAD continues to grinds down within a clear channel and is one on every trend follower’s radar. Moves into the 20-day EMA have been met with fierce supply, with the top channel resistance also a key headwind. The risk is the pair doesn’t retrace to entry, but both price action and trend suggest further downside.