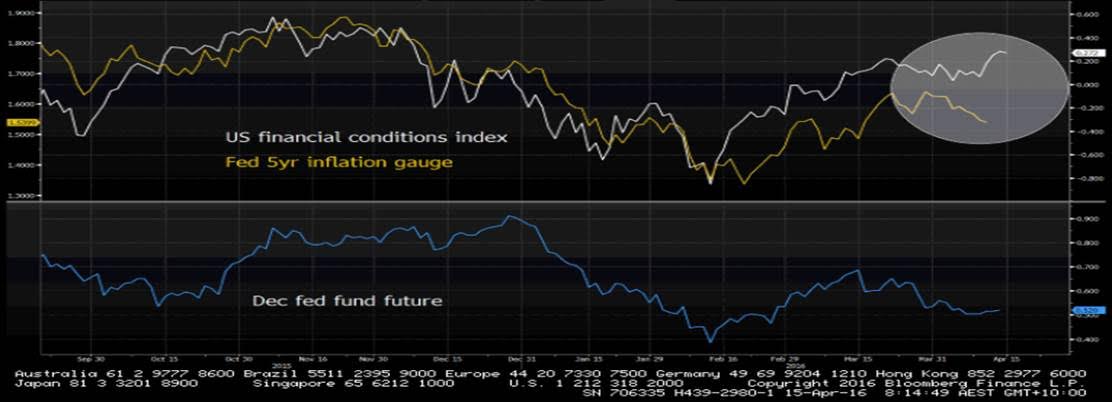
Chart of the day – One of my favourite charts around. Here we see the Bloomberg US financial index (white line) relative to the Federal Reserve’s own five-year inflation expectation gauge (yellow line). The US financial conditions index incorporates credit spreads, implied volatility measures, the S&P 500 and money market spreads, so when the index is going up we are seeing positivity flowing through markets. Traditionally, inflation expectations have followed financial conditions closely and subsequently the Fed funds future (blue line) have too. The Fed funds future is simply an interest rate market where traders can express a view around future Fed hikes (or cuts), so if this (ie. the yield) is going up, then traders are saying there is a higher chance of a hike by year-end.
The fact that financial conditions continue to improve but inflation expectations and interest rate expectations remain anchored is a huge positive for traders. The correlation has broken (thank you Janet Yellen) and as long as the market doesn’t price in a higher probability of hikes, then US equities (and presumably other developed markets) will find buyers.
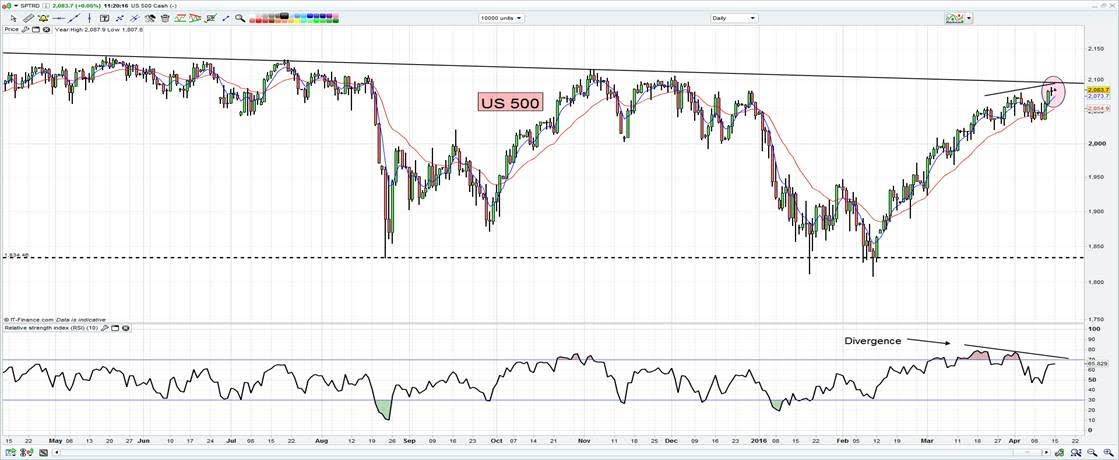
S&P 500 – Following on from my ‘chart of the day’, the S&P futures printed a doji yesterday. This showed indecision in the market, but importantly the bulls have regained control today. There is divergence playing out between price and the RSI, but we do need to see price confirm this with a lower low. This isn’t playing and traders are eyeing an upside break of the May 2015 downtrend. A rejection of the trend would be bearish given the negative divergence and suggests we could be seeing better downside. Given the above chart, the probability is that we see an upside break of the trend.
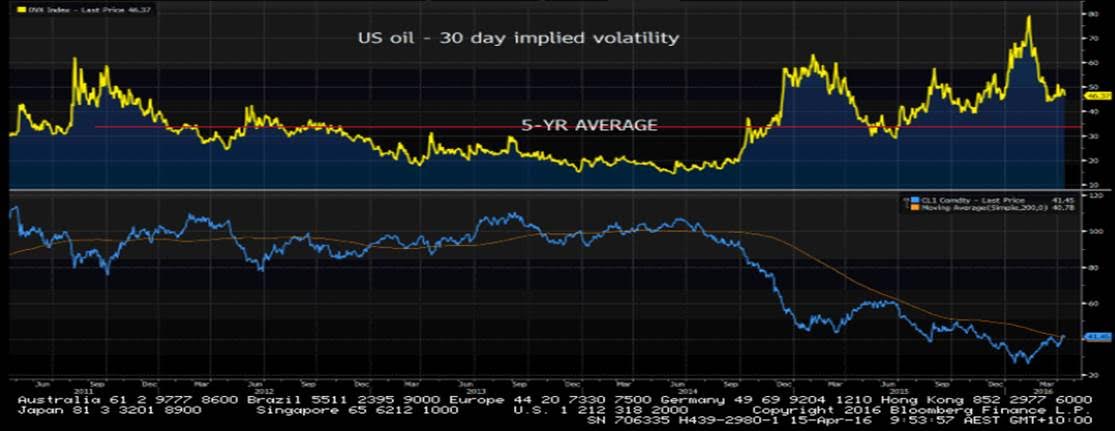
US crude – All eyes on Doha this weekend and the OPEC (and non-OPEC) meeting. Expect some sort of agreement of a production freeze, but the devil is clearly in the detail. Looking at the top pane, we can see oil’s 30-day implied volatility is above the long-term average but not at extremes. Traders are therefore not expecting a huge move in the short-term. The lower pane shows oil has reclaimed the 200-day moving average. A sustained move above this longer-term trend is naturally bullish.
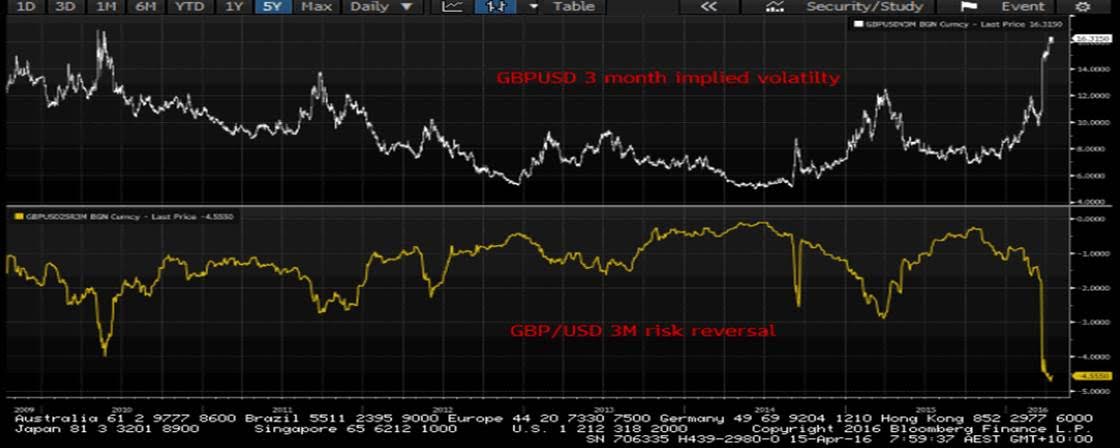
Volatility (vols) – Staying on the theme of volatility, I think GBP/USD vols are huge right now. Everyone has hedged their ‘Brexit’ risk and it is now so expensive to hedge GBP volatility that they have been buying EUR and CHF vols too! The lower pane shows risk reversals (the cost of puts vs calls) at extreme lows too. One questions how this plays out if the bookies are correct and the British public votes to ‘remain’. GBP will likely have a monster rally. Timing these moves is key.
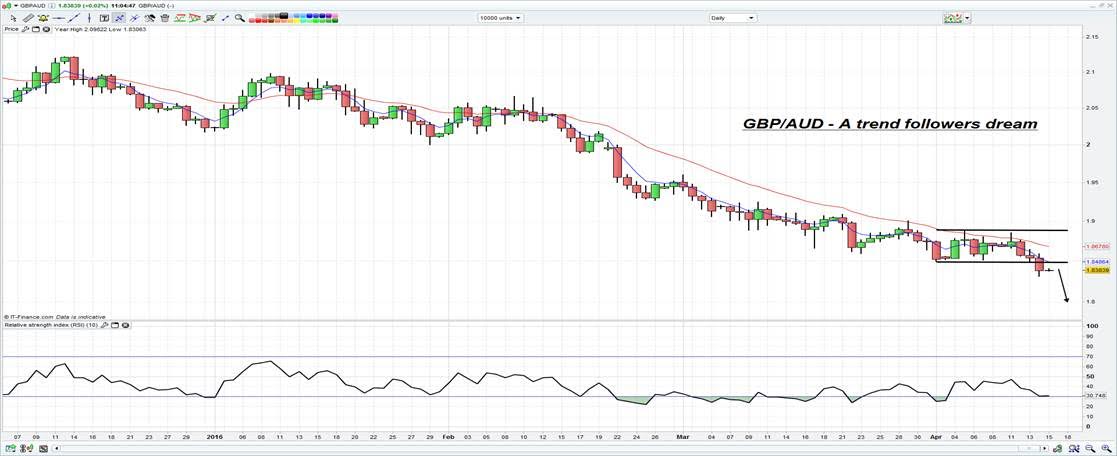
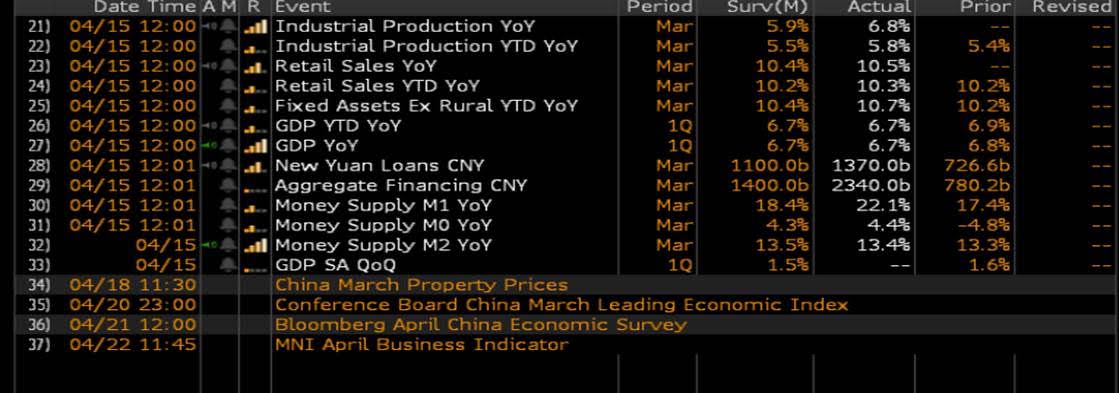
GBP/AUD – Traders have focused their attention on AUD/USD today given the strong China March industrial production (see Bloomberg print below) and financing numbers. AUD/USD is threatening to break the recent double top, but the better trade has to be GBP/AUD. This is a trend trader’s dream and we’ve just seen the period of consolidation giving way for a resumption of the downtrend. Holding GBP shorts is scary (given implied vols), but for those who like trends this is about as text book as you will see. A slight retracement is preferred as an entry, but shorts are the way unless the pair can re-claim A$1.8500.
For today’s China data drop, industrial production is key. As I have been saying, China is not the concern right now, Japan is.
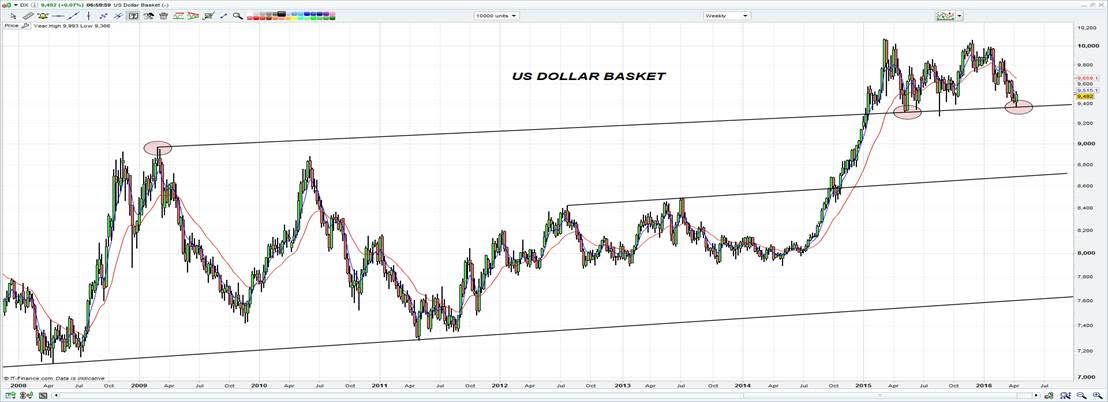
US dollar basket (weekly chart) – Needs no real commentary, you can see how key the 9360 area is. Seems to be holding which is very interesting. As I’ve been highlighting, watch FXI (iShare China ETF) when the NYSE opens.
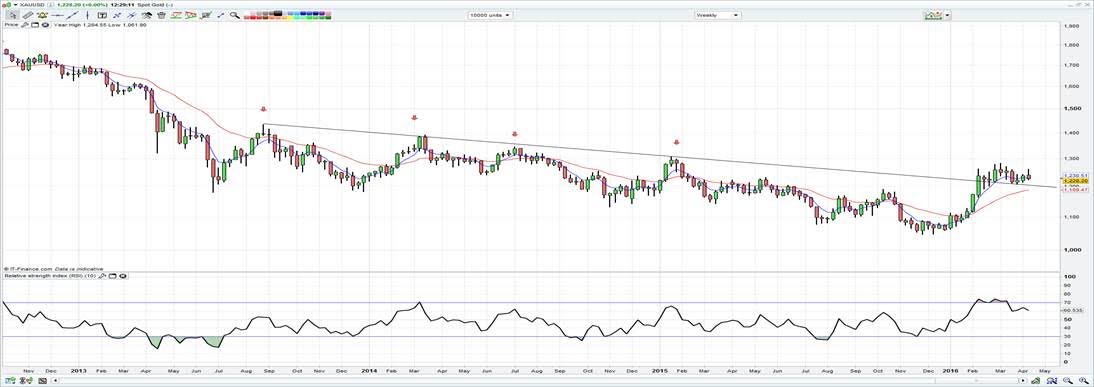
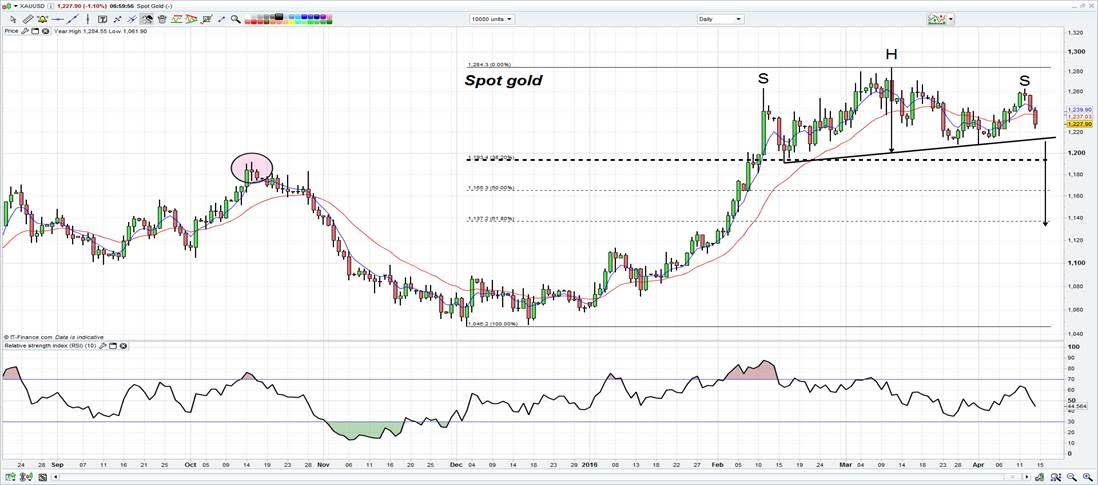
Spot gold – The daily (and weekly below) chart is really interesting. A break of the neckline of the head and shoulders pattern at $1214 would target $1140. $1193 would be the initial key support though, representing the 38.2% retracement of the December to March rally. This chart has been passed around quite liberally by traders, so expect a break to get a lot of attention. Absolutely one for the radar.
Spot gold weekly – A slightly different perspective from the daily chart. However, the same story is true, a break of the former downtrend at $1210 on a weekly basis would be taken as a bearish signal. Basically a daily close below $1210 would suggest short gold positions. A weekly close and the conviction is even more elevated.