Angus Nicholson for Chris Weston, Chief Market Strategist at IG Markets
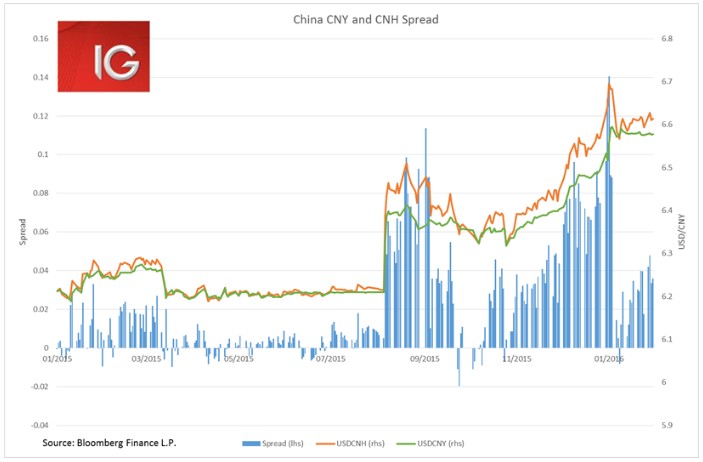
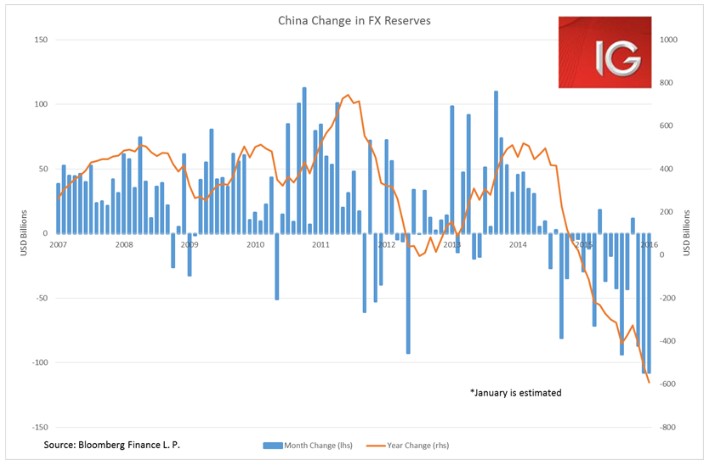
China’s FX reserves for January will be released 7 February, and whatever the number it looks like it will be causing some volatility in the offshore CNH. The spread between the offshore and onshore Chinese yuan has been growing again since 18 January. And today we saw the sharp strengthening of the CNY midpoint by 0.2%. This may perhaps be trying to move the rate against some speculators ahead of the FX data release.
Estimates are for reserves to decline by anywhere from USD 100-200 billion in January, after heavy intervention to reduce volatility between the offshore and onshore rates. But any number in that range is likely to increase devaluation speculation as total reserves approach the magic number of USD 3 trillion.
Is the end to the oil and high yield selloff coming?
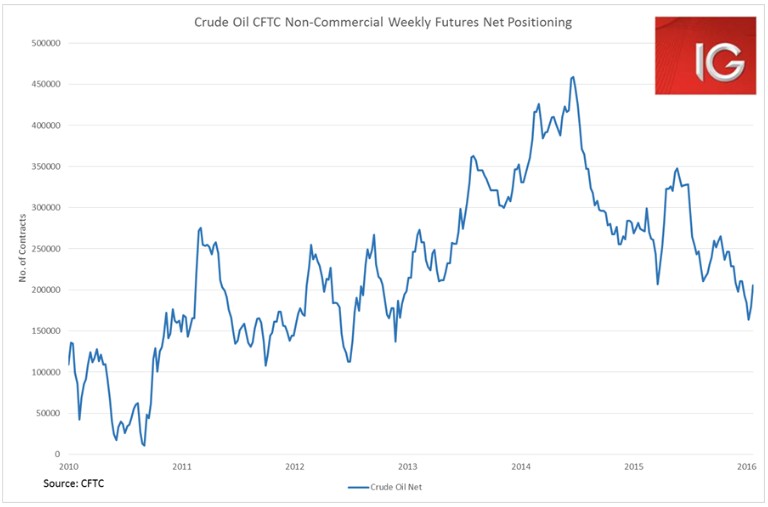
There have been some amazing moves in the oil price of late, but it is difficult to sort out the hype from the fundamentals. Clearly, the big drop in the US dollar overnight and rumours that OPEC may call an extraordinary meeting helped move the oil price, but neither of these are likely to have a substantive long-term impact. From the weekly CFTC data it is clear that the second half of January saw a significant amount of short covering. WTI’s drop into the US$26 handle and Draghi’s hints at a March easing by the ECB seem to have been the major drivers behind the short covering.
Unfortunately, we did see a similar move play out during oil’s August selloff. A big drop in oil, followed by a US non-farm payrolls miss and a flurry of Chinese stimulus announcements resulted in a lot of short positions covered. But once the WTI spot price had recovered about 20-30% from its lows, investors re-entered their short positions and took the market even more net short than it had been.
In the near term, another trip deeper into the US$20 handle seems highly likely. Proximate causes of a renewed selloff could stem from China (worse-than-expected economic data or currency devaluation), the inability for OPEC to agree on supply cuts, or far bigger Iranian output than expected, deteriorating US data and a collapse in the dollar index. What we have learnt from January is that oil under US$30 a barrel greatly accelerates the forces of rebalancing in the oil market. Calls for extraordinary OPEC meetings, floating the idea of listing closely state-held oil firms; all these developments make clear how much pain is caused with the spot price at such low levels.
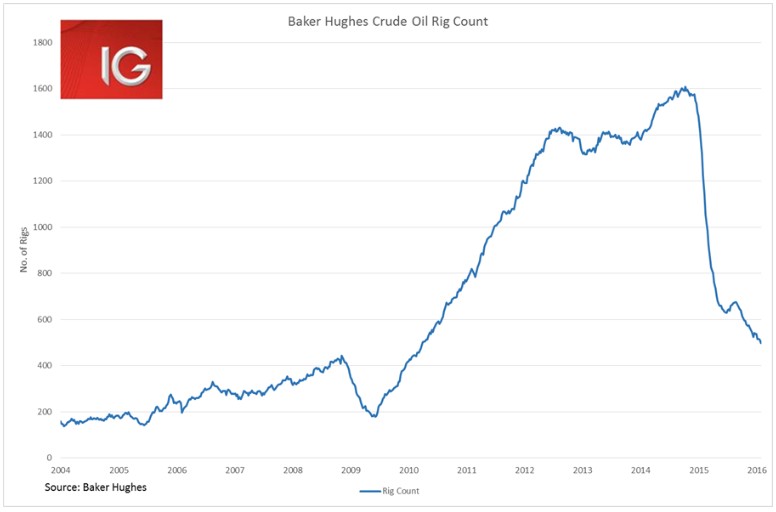
Some of the harshest rebalancing has been in the US shale space. The Baker Hughes US crude oil drill rig count declined by 64% in 2015. Its release last week saw the rig count drop to 498. For reference 442 was the highest level reached in 2008, prior to the post-GFC boom in shale oil production. For emphasis: a decline of 56 more rigs in the US and it would be as if the shale oil boom had never happened in the US (in drill rig count terms).
All of this data does seem to indicate that the oil market is nearing the cyclical low, and I would venture that low in WTI is probably in the US$ 20-25 region. Certainly, if one had the capacity to suffer the wild swings in the spot oil price, one would be a buyer at that price.
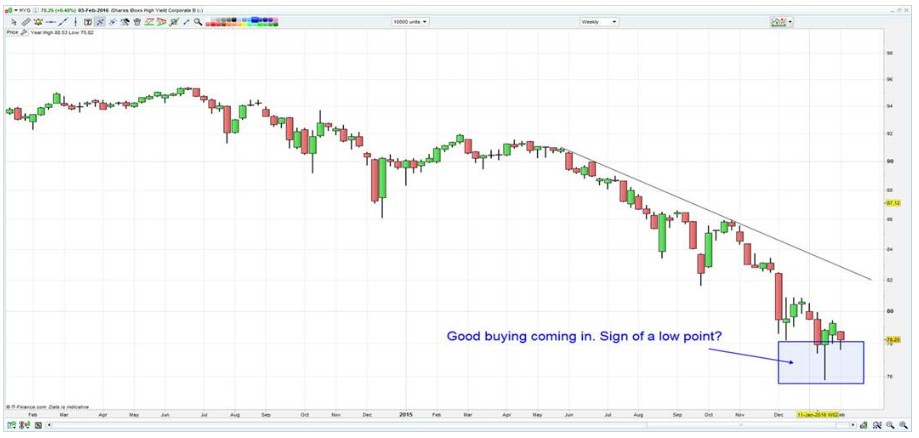
But there are other ways to play the oil price. Probably options bets on oil price volatility are the smartest way to play it. Picking up energy producers with competitive breakeven points and conservative gearing would be another way. However, the bottoming of the oil price could also be the best time to make a contrarian play on the high yield bond sector. The easiest way for everyday investors to trade this would be through the US-listed ETFs HYG (iShares iBoxx $ High Yield Corporate Bond ETF) and JNK (SPDR Barclays High Yield Bond ETF).
There are a couple of reasons why HYG and JNK may be a better place to express bullish long-term views on the oil spot price. The main one is yield: HYG is currently yielding over 9% and JNK over 6%. If energy prices do start to recover in the second half of the year, and these ETFs see at least an 11% capital gain, one would be looking at a solid 20% total return (in the case of HYG). Once we see a bottoming of the oil price, it seems a fair bet that yield-starved investors will be piling back in with those sorts of returns. With the BOJ now joining European central banks in negative interest rate territory, more than 20% of the world’s economy has negative nominal interest rates.
The high yield bond market has become increasingly correlated with the oil price of late. Using a 90-day correlation coefficient, you can see the correlation between HYG and WTI is at its highest level since 2012 at R2=0.54 (with shorter time-periods the correlation is even higher) and it has increased significantly since the beginning of 2016.
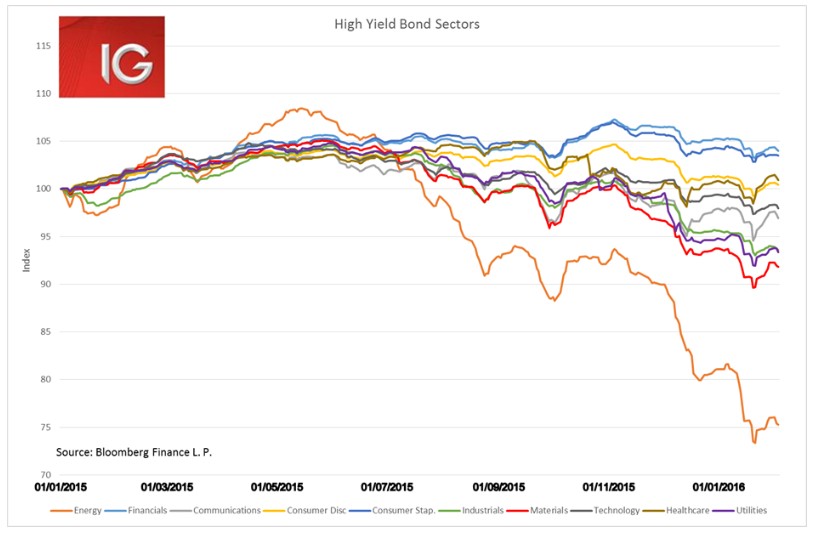
The concern some have raised is that the deterioration in the high yield market has been spreading from energy to other sectors of the market. While this is true to some extent, a careful examination of the sectoral performance in the high yield space shows that energy has been the biggest drag by far. With an end to the selloff in the energy high yield space, high yield indices look primed for a dramatic turnaround in 2016.
Another risk is that HYG is in a strong downtrend and it is never advisably to invest, trade or put money to work in this environment. However, as we can see in the weekly chart HYG seems to have put in a bottom, with really strong buying coming in. Are we set to see a reversal? Perhaps, but it does suggest that investing in the ETF needs to be done in small size for now.