January 19, 2015 the National Bureau of Statistics released the national real estate development and sales data, in 2015, the national real estate development and investment 9.5979 trillion yuan, up for sale in the area of 718.53 million square meters, compared with the end of 2014 an increase of more than 100 million square meters, an increase of 15.6 %, the highest in history.
According to the National Bureau of Statistics, as of the end of 2015, the national housing sales by area was 452.48 million square kilometers, an increase of 11.2% over 2014, accounting for 63% of the real estate inventory. Other aspects, office stock amounted to 3276 square kilometers, representing an increase of 24.7%. Commercial space inventory of 14,664 square kilometers, an increase of 24.6%.
Southern Reporter found that people in our country because of the current state to urban mobility, residential demand is relatively strong, so the real estate industry has always been for the bulk of commercial housing, the high proportion. However, the current economic downward pressure, the purchase needs of consumers restrained, housing stock remains high, housing prices become the body burden.
…”The current Chinese real estate market is not absolute glut, but local surplus.” Feng Jun, secretary general of China Real Estate Association, told reporters that the case of the south.
From a regional perspective, 2015 first-tier cities housing prices are rising, sales also achieved good results, which are driving the stock continue to digest and updated. Meanwhile, the third- and fourth-tier cities prices fell, market transactions have also been deserted. Around the property market can be described as being of mixed. The third- and fourth-tier cities have yet to come out from the real estate winter.
…”Because of the slow population growth in third- and fourth-tier cities, low income leads to lack a of purchasing power, reducing demand. Plus real estate agency inventory in the third- and fourth-tier cities is increasing, the accumulation of too much inventory, and now find it difficult to digest.” Radius Deng, chief real estate analyst Hiroshi interview with Southern reporters said that stocks in some cities has reached 20 months, 30 months or even more, supply is much greater than demand. Therefore, government and housing prices this year, the focus will be placed to the stock four-tier cities, and actively promote these cities to digest the stock.
And recently, Wanda Group Chairman Wang Jianlin analysis Financial Forum in Hong Kong assertion, four-tier cities in China property stocks may take four to five years time to digest.
Due to the high cost of land, real estate investment risk first and second-tier cities high. Wanda real estate and investment mainly in the second and third tier cities of the commercial real estate. Wang Jianlin that “real estate sales are highly concentrated in first- and second-tier cities, 36 cities accounted for three-quarters of the country’s total sales, so the proportion of third- and fourth-tier cities is very low, as long as they slowly begin to reduce inventory, it there will be no problem.” iFeng: 7亿库存:三四线城市销不动 北上广深补存量
Recall that 75% of construction is in second and third tier cities. This is not a cyclical challenge it is structural. China is built out and there really is nothing that authorities can do about it as housing starts fall -15% year on year even as the glut gets bigger. This is the core problem facing commodity demand worldwide as Chinese residential construction consumes 40% of its steel output.
Worse, manufacturing is another 30% and it too is built out, from Citi:
Advertisement
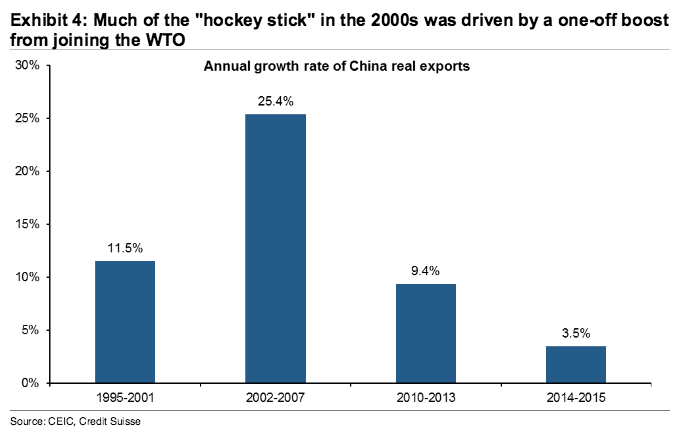
At the risk of oversimplifying, we think that the so-called Chinese “hockey stick” seen in the 2000s was a “one-off” event driven primarily by Chinese accession to the World Trade Organization and the increased market access that membership provided across the developed world.
[A]fter growing at a steady pace of around 11% over the decade up until 2001, the pace of real Chinese export growth more than doubled in the period up to the Great Recession, with other measures of growth (GDP, IP, steel production, etc.) following a similar pattern.
Of course, the problem with an increase in market share is that the adjustment is likely to be a one-off event, with growth likely to return to a more “normal” level once the new market share “equilibrium” has been attained.
For China, this “adjustment” back to a more normal growth model has been made much more difficult by external events and by the sheer size of the Chinese economy.
While small countries such as South Korea, Taiwan, or even Japan, have shown that they can continue to drive growth through exports for many decades (and to levels of GDP per capita relative to the US much higher than is currently the case in China), in part this has been due to their small size and limited impact on the markets on which they rely.
Even after decades of export-led growth, an economy the size of South Korea is far from a dominant player in the broad import share for Europe and the US.
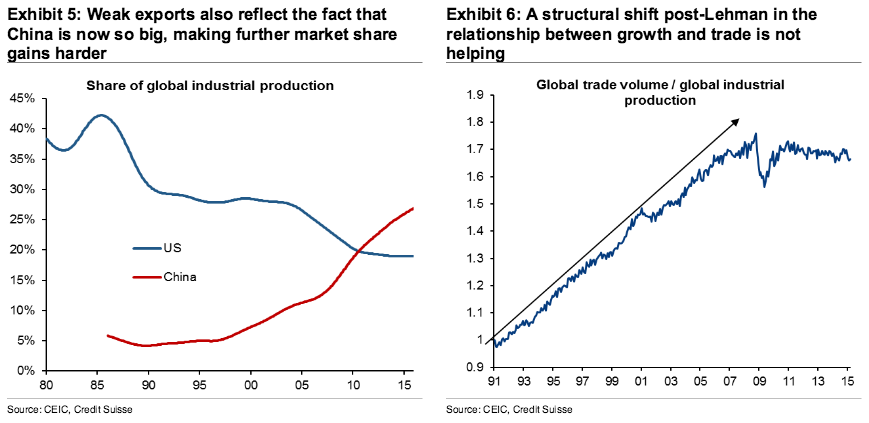
In contrast, despite GDP per capita only increasing to a still-modest 25% of that seen in the US, China now accounts for fully a third of global industrial production (up from only 5% as recently as the 1990s)–see Exhibit 5.
When you are that big, it becomes increasingly difficult to grow exports and production at a pace materially faster than growth in final global demand, which has averaged about 3% for the past few decades.
In addition, since the Great Recession, the relationship between global trade and output (GDP or IP) seems to have changed, with trade no longer growing faster than the overall global economy (Exhibit 6).
For those economies where growth models have tended to be focused on external support like China, this change has introduced substantial new challenges as they try to overhaul their growth models.
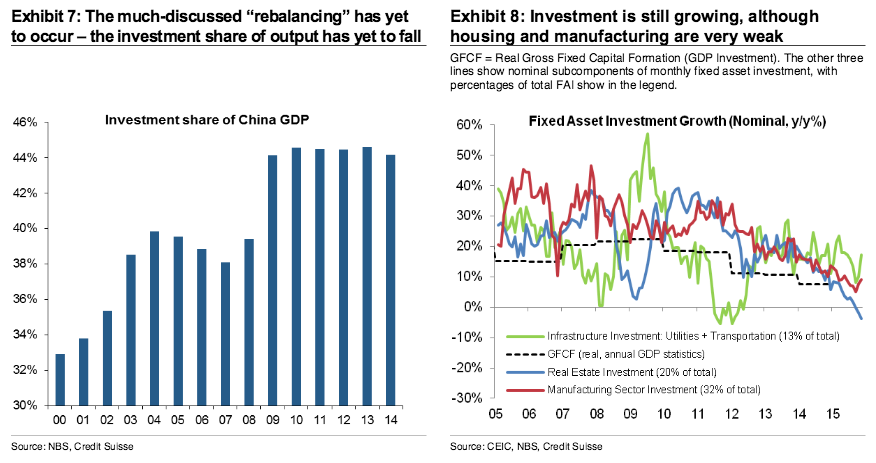
These structural factors, along with the fact that external demand has remained mediocre since the crisis, has meant that China is attempting to “rebalance” its economy against a backdrop of dramatically weaker export growth, as evidenced in Exhibit 7.
Finally, after a period of “rebalancing” away from investment toward consumption in the mid-2000s, the Great Recession was a tremendous setback to the ultimate objective of more balanced growth.
Indeed, the main policy mechanism for fighting the slowdown in 2008 and 2009 was a massive increase in investment, which we now know occurred at just the time that the export-driven growth model was breaking down.
Unfortunately, despite the substantial growth slowdown of recent years, there is little evidence that investment as a share of GDP has fallen substantially from the post-stimulus highs. Indeed, at least through to 2014–the latest comparable data available–all that has happened is that the investment share has stopped going up (Exhibit 8).
China is going ex-growth, especially in commodity consumption as the investment share of GDP falls (mostly ahead). It has only just started and there is no way to stop it.
David Llewellyn-Smith is Chief Strategist at the MB Fund and MB Super. David is the founding publisher and editor of MacroBusiness and was the founding publisher and global economy editor of The Diplomat, the Asia Pacific's leading geo-politics and economics portal.
He is also a former gold trader and economic commentator at The Sydney Morning Herald, The Age, the ABC and Business Spectator. He is the co-author of The Great Crash of 2008 with Ross Garnaut and was the editor of the second Garnaut Climate Change Review.