
Chris Weston, Chief Market Strategist at IG Markets
The question traders are asking today is whether the selloff in high yielding corporate credit steam will roll into something more sinister?
Is there enough liquidity if further redemptions materialise from retail investors out of open-ended credit funds? Many strategists with a more detailed knowledge of the credit space are not going to be overly surprised that Third Avenue Focused Credit Fund has closed the exit gate on redemptions, given the holdings in the fund are illiquid and generally of low quality, and there have been numerous calls of a heightened risk of a run from supposedly open ended funds.
There is now strong focus on whether we will see the spill over into higher quality bonds. Looking at the spread between BB rated index and US five-year spreads we can see a deteriorating trend, although not to the same extent as the CCC rated issuance. This is one to watch and has the potential to keep equities offered.
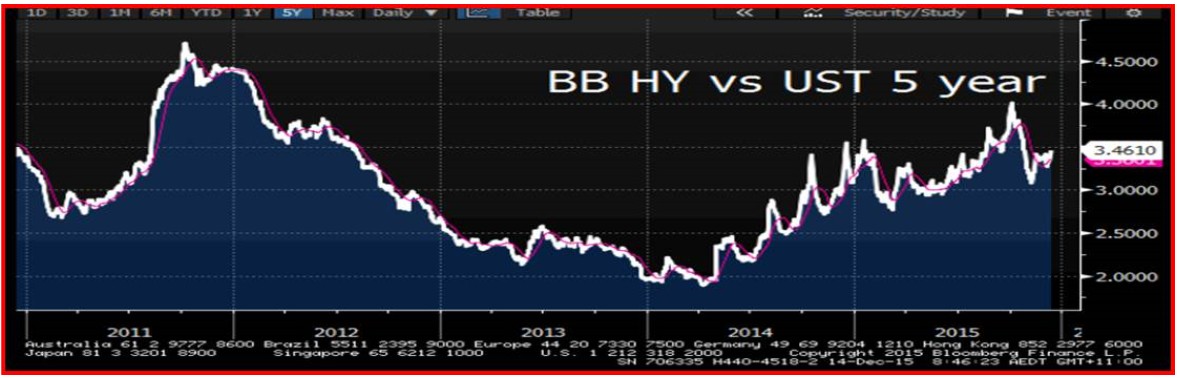
(Source Bloomberg)
The two most watched high yield ETF’s are JNK and HYG. What we saw on Friday in HYG was nothing short of breathtaking, with 54 million shares trading hands. To put this in perspective, this was nearly four times the 15-day average.
There is also intense focus around the path of the Chinese yuan in light of USD/CNY closing at the highest levels since August 2011. A weaker CNY is a big consensus trade for 2016, but the news on Friday that China was guiding the market to focus more closely on a trade-weighted index of currencies and away from USD/CNY is only going to increase conviction on CNY or CNH shorts. Under the weighting system, the AUD commands a 6.27% weight, the fifth biggest weight behind the USD (26.4%), EUR (21.39%), JPY (14.68%) and HKD (6.55%). This will now be the best guide as to how Chinese monetary authorities will act on the CNY going forward. Less focus on USD/CNY and more on the CNY versus the crosses.
In many ways, the CNY is the most important currency to watch in 2016 and the ramifications of its pronounced devaluation will have on their own corporate landscape and international economics too.
The carnage in the US has naturally filtered through to Asia, but clients today have been leaning towards a bias to buy. S&P and oil futures opened on a flat note but has seen some buying coming through with very only modest inspiration from the strong Chinese data, with November industrial production improving 60 basis points to 6.2%. AUD/USD traded to $0.7218 in early interbank trade, but has sharply pulled back highlighting that many see this data point assisted by base effects and measures to aid the auto sector. It also shows that traders have little confidence in holding the AUD in an environment of falling commodities and a government that is likely to show a strong deterioration in the budget projections in this week’s Mid-year Economic and Fiscal Outlook.
My preference is for selling rallies in the Nikkei 225 as the selloff is looking a little overdone, but for the first time in a while price action is suggesting a strong underperformance from Japanese equities. The ASX 200 is down for a fifth day; one can feel that elastic band being stretched, but is it far enough?
My personal view is the time to fight this progressively bearish trend is not now, especially with the index closing below the multi-year uptrend. The technicals are not screaming oversold yet, while the market internals are not either. 4900 is three standard deviations from the 20-day moving average and a move here would see the RSI’s move into the mid-20’s. The percentage of stocks above the 20- and 50-day average sit at 23% and 39% respectively and I’ve found it quite a reliable contrarian buy indicator to look at long positions in the ASX 200 when the level of stocks above the 50-day average move into the 15% area.
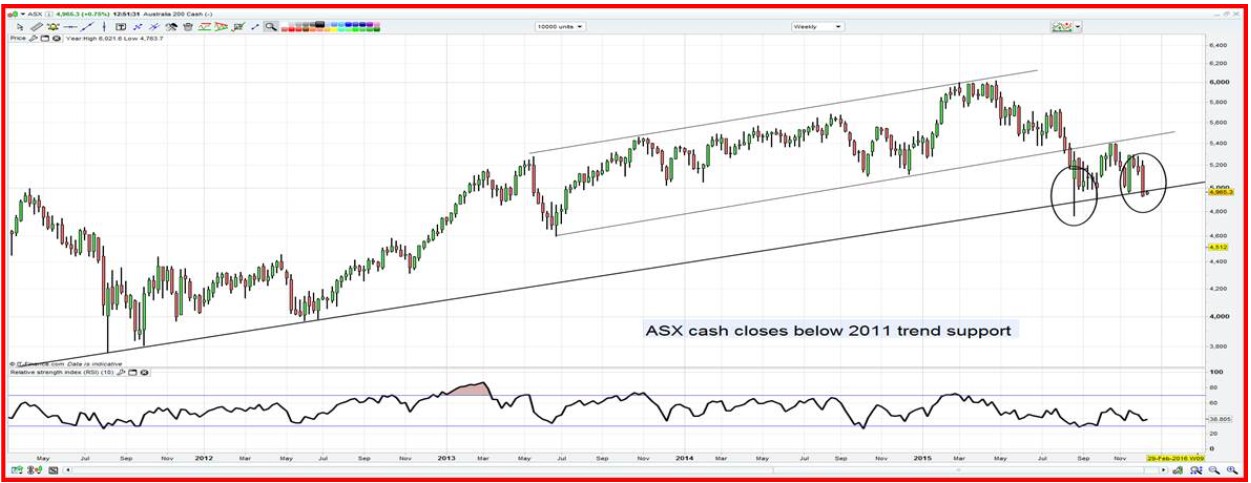
Weekly chart of the ASX 200
The financial sector, which effectively carries nearly a 50% weight on the index, seems to be tracking at a perfect inverse to the US volatility index (or ‘VIX’ index). Of course, the inverse correlation is not tick-for-tick or the financial sector would have fallen 65% last week, but it does show that in times of implied volatility, traders will sell out of income structures and head for cash. For the ASX 200 to find buyers into 4900, we will need to see traders selling volatility.
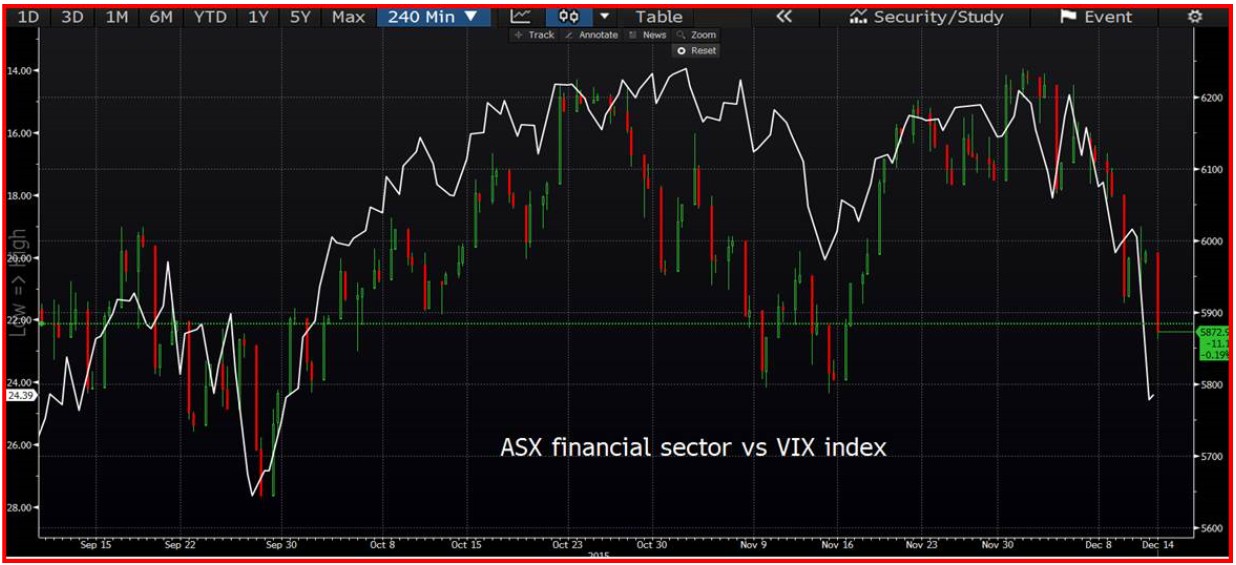
VIX index has been inverted
On this point of volatility, the Federal Reserve would be loath to hike this week when the VIX is 46% above the year’s average. Then again, they will be loath to raise the funds rate in an environment of deteriorating credit quality, a flattening yield curve, a trade-weighted USD at a 12-year high and ultimately financial conditions indices below zero – highlighting a headwind to economics. They will hike rates though and it’s going to be fascinating to see how Janet Yellen communicates their message to the market.
I would not be surprised to see further downside in risks assets (including equities) before stability and even a move higher in the wake of the Federal Open Market Committee meeting. I’d certainly be watching the US volatility index as my guide and would expect good selling opportunities after the meeting.
Ahead of the open we are calling the FTSE 5949 -3, DAX 10338 -2, CAC 4553