In many ways our 2016 forecast is “déjà vu all over again.” The US stock market has mostly traded sideways during 2015 with the index hovering in a narrow band except for a brief late summer correction. Return dispersion across the market and within sectors has been low. Market breadth is currently at one of the lowest levels in 30 years. About 75% of large-cap core mutual funds is lagging the benchmark. The equity long/short hedge fund index has returned -2% YTD, trailing S&P 500 for the seventh consecutive year. About 75% of large-cap core mutual funds is lagging the benchmark. The equity long/shorthedge fund index has returned -2% YTD, trailing S&P 500 for the seventh consecutive year.
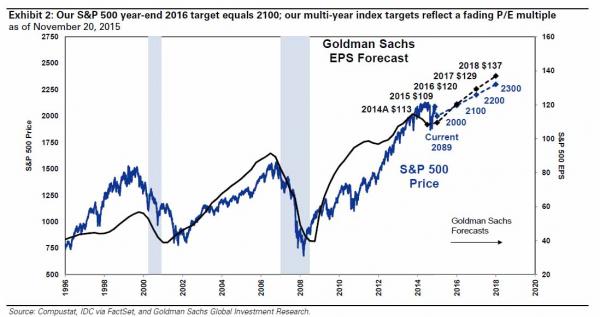
In terms of fundamentals, Goldman Sachs US Economics Research expects tepid GDP growth of 2.2% in both 2016 and 2017. We forecast S&P 500 earnings will rise by 10% to $120 per share in 2016 and by 7% to $129 in 2017 (see Exhibit 1). However, the headline EPS growth rate is misleading because it reflects a partial recovery in Energy sector profits after they collapsed by 80% this year in concert with the plunge in crude oil. EPS growth outside Energy will equal 8%. We expect flat net profit margins of 9.1% in 2016 and 2017.
In terms of valuation, both the aggregate S&P 500 index and the median stock trade at the high end of a range of fair value based on most metrics. Our year-end 2016 index target of 2100 implies a P/E multiple compression of 8% to 16.2x our top-down 2017 EPS estimate, or 12% based on the bottom-up consensus earnings forecast. S&P 500 P/E multiple fell by an average of 10% in the 12 months following the start of prior tightening cycles. The typical S&P 500 constituent has a forward P/E of 17.2x, an EV/sales of 2.4x, an EV/EBITDA of 10.8x, and a P/B of 3.0x. Only 6% of the time during the last 40 years has the median stock traded at a P/E multiple higher than it does today.
In terms of money flow, corporate repurchases will remain the primary source of demand for US equities. Firms that have returned cash to shareholders via buybacks and dividends have outperformed for 25 years. The pattern was repeated this year and the trend will likely continue in 2016 given our muted equity return forecast (see S&P 500 cash spending trends: Investing vs. returning capital, November 6, 2015).
In terms of risks, uncertainties include (1) interest rate path different from our baseline assumption of year-end 2016 fed funds at 1.4% and 10-year bond yields of 3.0%; (2) global economic growth below our 3.5% forecast; (3) US presidential election; and (4) geopolitics.
I can wear that S&P forecast for the next year as markets delude themselves that rate hikes are good but global growth is not going to be 3.5%. 3% is the base case. Below 2% and effective recession the risk case. Why? China will keep slowing and emerging markets will get hammered. At some point that will trigger an end of cycle event for US stocks. Could certainly be next year, nearer the end.
David Llewellyn-Smith is Chief Strategist at the MB Fund and MB Super. David is the founding publisher and editor of MacroBusiness and was the founding publisher and global economy editor of The Diplomat, the Asia Pacific’s leading geo-politics and economics portal.
He is also a former gold trader and economic commentator at The Sydney Morning Herald, The Age, the ABC and Business Spectator. He is the co-author of The Great Crash of 2008 with Ross Garnaut and was the editor of the second Garnaut Climate Change Review.