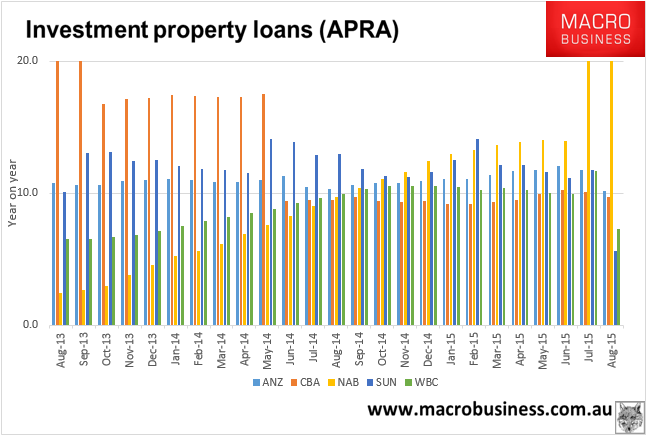
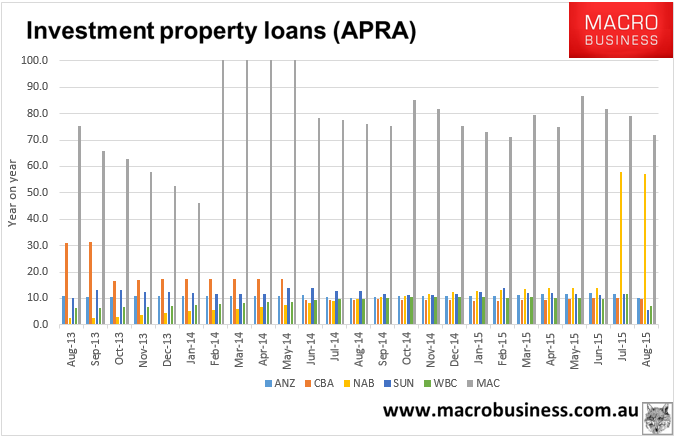
APRA has released its August banking statistics and at last macroprudential tightening is in evidence. Here are the investor lending portfolio numbers for the big six banks:
| ANZ | CBA | MAC | NAB | SUN | WBC | Total | |
| Aug-15 | 10.2 | 9.7 | 72.0 | 57.0 | 5.6 | 7.3 | 16.0 |
| Jul-15 | 11.7 | 10.1 | 79.1 | 58.0 | 11.7 | 11.7 | 18.1 |
| Jun-15 | 12.0 | 10.2 | 81.6 | 14.0 | 11.1 | 9.9 | 11.6 |
| May-15 | 11.8 | 9.9 | 86.8 | 14.1 | 11.6 | 10.0 | 11.5 |
| Apr-15 | 11.7 | 9.5 | 74.8 | 13.9 | 12.1 | 10.3 | 11.3 |
| Mar-15 | 11.4 | 9.3 | 79.3 | 13.6 | 12.1 | 10.4 | 11.3 |
| Feb-15 | 11.1 | 9.2 | 71.0 | 13.3 | 14.1 | 10.2 | 11.0 |
| Jan-15 | 11.1 | 9.2 | 73.1 | 13.0 | 12.5 | 10.4 | 10.9 |
The big jump in the growth rate in the last two months is the result of NAB recategorising a huge slab of older loans as “investment”. If we remove that distortion the overall growth rate falls to just below 10%.
I find it hard to believe that WBC has slowed so quickly so I’m wondering if that is not again some portfolio adjustment. Even so, the other three majors continue to slow towards the 10% limit (NAB is about 12% now when we remove the distortion) and even MQG barely grew in the month, though it’s previous growth is so ludicrous that it’ll take months for it to show up in the data: