Daily iron ore price update (future funk)

Advertisement

Here are the iron ore charts for July 16, 2015:

Capture 1 2 3

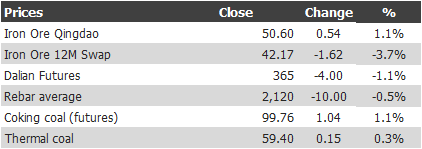
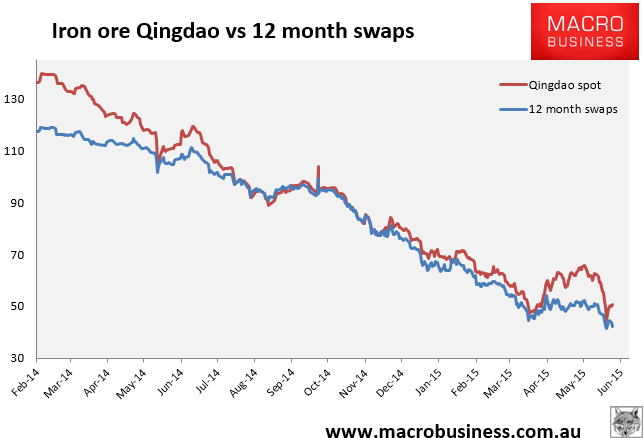
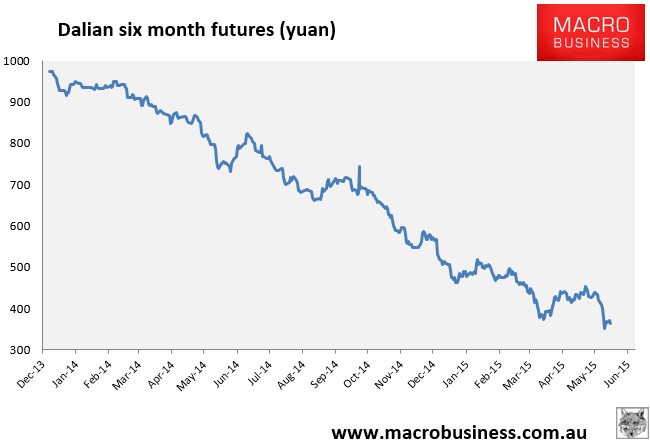
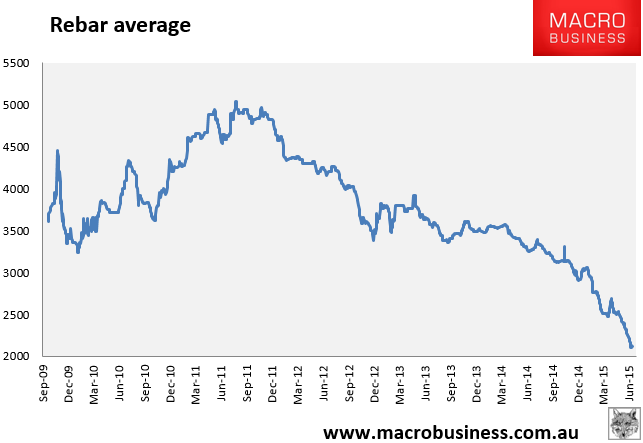
Note that these charts are over two days of data. Qingdao is up a little. Tianjin benchmark slid 0.2% to $50. Singapore 12 month swaps are getting caned and look like they’re headed for further breakdown. Dalian slid yesterday but rose overnight 3 points to 368. The rebar average dead cat has stopped bouncing. Further price pain is inevitable not least because of the news from RIO yesterday that it will ship 50 million tonnes more iron ore in the second half than it did the first. BHP and RIO both bounced strongly in London just because.

Other forms of pain that are looming for Australian miners were again illustrated by Anglo overnight, from the WSJ:

Advertisement

The full text of this article is available to MacroBusiness subscribers

$1 for your first month, then:
Cancel at any time through our billing provider, Stripe
About the author
David Llewellyn-Smith is Chief Strategist at the MB Fund and MB Super. David is the founding publisher and editor of MacroBusiness and was the founding publisher and global economy editor of The Diplomat, the Asia Pacific’s leading geo-politics and economics portal. He is also a former gold trader and economic commentator at The Sydney Morning Herald, The Age, the ABC and Business Spectator. He is the co-author of The Great Crash of 2008 with Ross Garnaut and was the editor of the second Garnaut Climate Change Review.