
Chris Weston, Chief Market Strategist at IG Markets
Afternoon trade in Australia seems about as quiet and lethargic as the Australian supporters in the Edgbaston stands.
If we look at price action though, there hasn’t been a huge amount of concern about holding mining stocks into the weekend and the release of China manufacturing PMI (official). Consensus is for a reading of 50.1, although if we see a sub 50 read on the index (and therefore contraction) then there is the real risk of gapping lower on Monday.
Data during Asia has been fairly light, with Japanese employment and inflation providing no real catalyst for the Nikkei or USD/JPY. Here in Australia, the 5.9% increase in private sector credit was 10 basis points below forecast and the slowest pace since 2014. Many have been quick to point out that within this data release investor housing hit a seven-year high of 10.7%, which is 70 basis points above APRA’s threshold. AUD/USD has done very little and has traded in a $0.7305 to $0.7284 range.
The ASX 200 has tested the 5700 level again but supply seems to have kept a lid on the move. The Aussie index has found it hard to push through 5,700 on 24 June and 21 July, so a convincing break next week could see the index try and establish a new trading range. Will Aussie earnings season be that catalyst? Perhaps, but the bar is not really set low, so companies will not only have to give a view that they are seeing inspiring trends into 2016, but payout ratios (as a collective) will need to be above 70%. With the index trading on 16.1 time’s consensus forward earnings and a reasonable premium to the multi-year average, companies will need to really reach out to attract new shareholder capital.
Recall last year we saw 57% of ASX 200 companies beating full-year EPS estimates, with a lowly 37% beating sales. Aggregate earnings growth was 4.4%, which is a similar level expected this time around. This is the benchmark for this year’s earnings. I would certainly be looking at the portfolio and any stocks that have undergone significant gains and trading on a strong premium to intrinsic value and thinking hard about nimble hedging strategies.
(White line – ASX 200, Green – % of companies making a new 4-week high, purple line – % of companies above their 200-day moving average)
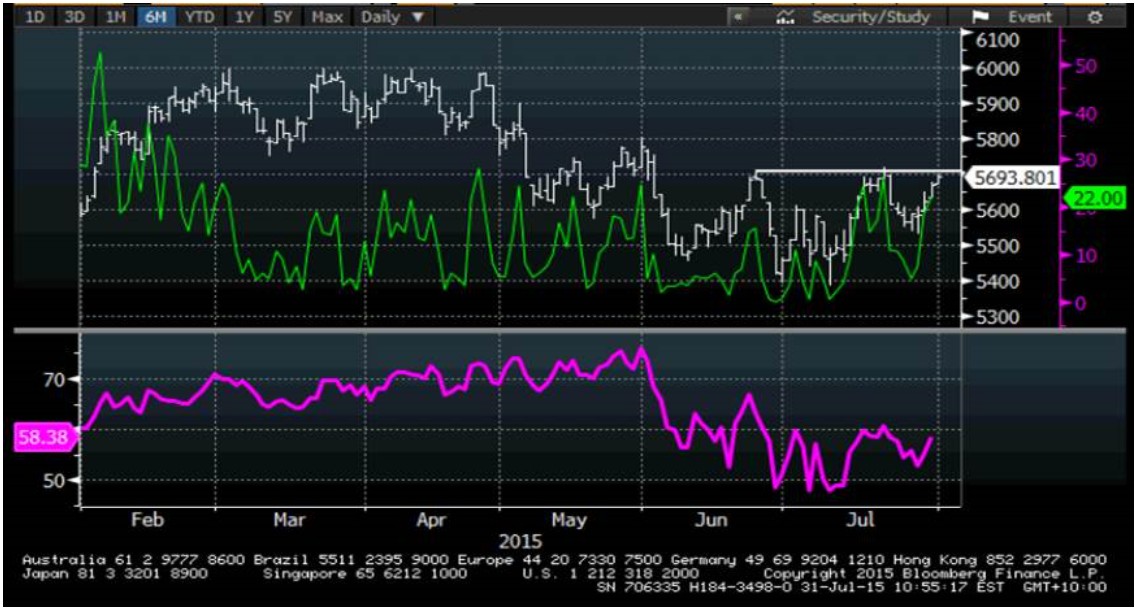
(Source: Bloomberg)
There are no smoking guns around the probability of market direction if we look at the internals of the ASX 200 either. Some 22% of companies have made a new four-week high today, just shy of the 25% print when the ASX 200 last tested 5,700 on 21 July. The level of companies above their 200-day moving average stands at 58%, again modestly lower than the last trip to 5,700. Breadth is therefore somewhat more bearish, but I wouldn’t be overly concerned. Only 4% of Australian stocks have a 14-day RSI above 70, so while you know the market is moving higher, it seems the bulls are still very hesitant to put money to work with any conviction.
Earnings in the US and Europe also continue to come in thick and fast, with 65% and 58% respectively of corporates having reported. US corporates have recorded 1% aggregate EPS growth (so far), but with a 73% beat rate this is still above the long-term average. European earnings growth is 15%, but the beat rate (predictably) is running at 56%. Watch earnings from Exxon and Chevron today.
One thing I would certainly be paying attention to is what happens to Brent and WTI from here as this will have key implications on economics. However, perhaps most importantly is the US two-year treasury though. Yesterday we saw a reasonable US Q2 GDP print (real GDP +2.4%) However, inventories cannot maintain the current pace and the US will need to see a higher contribution from net exports (contributed 0.1% percentage points), which may be hard given the trajectory of the USD. Consumer spending was the bright spot.
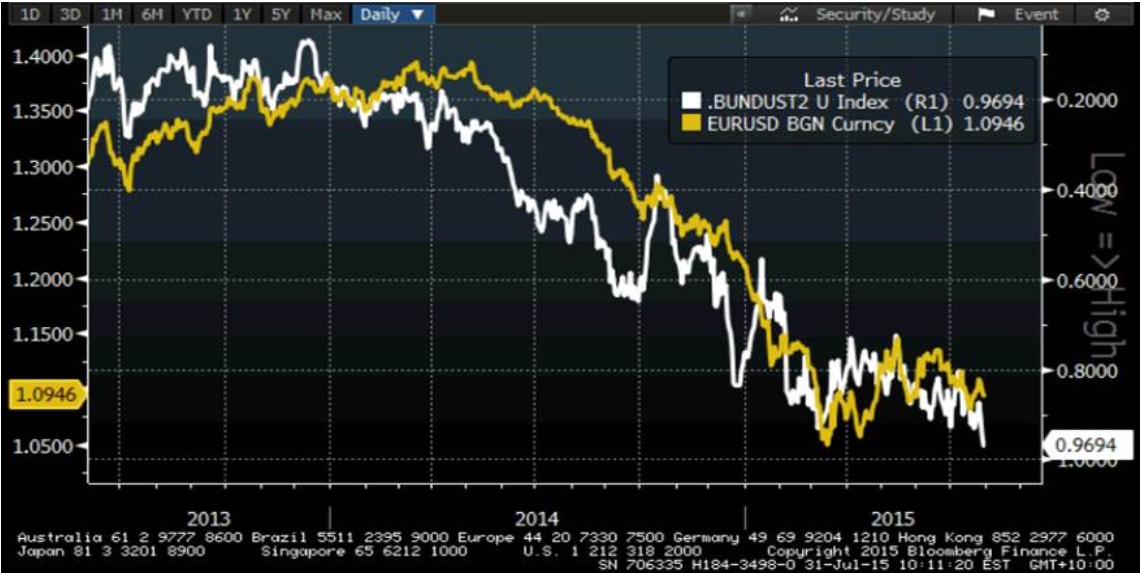
Still, we saw the two-year treasury pushing up a couple of basis points (or 0.02%) and testing the highs of the year. The move higher of late in US fixed income has driven the spread against German bunds (if we use this as a proxy for EUR) to the widest since July 2007. This is where divergence is seen at its purest form and suggests EUR/USD rallies should be headed to the $1.05 area.
EUR/USD (yellow line) vs US/German bond spread (right axis)
Rallies in EUR/USD it seems are to be sold, especially if today’s US Employee Cost Index (ECI) can cause further selling in US bonds (yields higher). Economists expect a slightly slow pace of employee costs (essentially wages) and above consensus 0.6% would certainly help keep spreads wide. On the EUR side we get unemployment data, Italian inflation and Belgium GDP.
For what it’s worth, the fed funds market is pricing in a 48% chance of a move in the fed funds rate in September, up from 42% just after the FOMC meet. There is a 54% chance of an October raise, but it seems expectations are moving in favour of September.