From the IMF today comes spectacular research on the Chinese property bust:
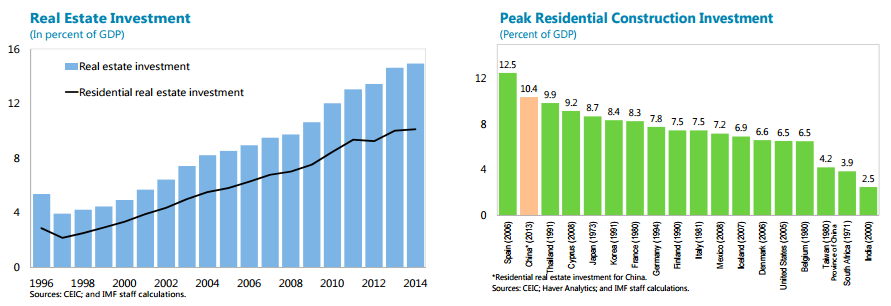
Real estate has been a key engine of China’s rapid growth in the past decade. Real estate investment grew rapidly from about 4 percent of GDP in 1997 to 15 percent of GDP in 2014.2 Residential investment, in particular, has been high compared with that in other countries. Today, it accounts for both about 15 percent of fixed asset investment and 15 percent of total urban employment. Bank lending to the sector accounts 20 percent of total loans. Real estate has strong linkages to several upstream and downstream industries (Liang, Gao, and He, 2006) and sales are also a key source of local public finance. Properties are extensively used as collateral for corporate borrowing.
Real estate activity has softened starting in 2014. Available data suggest a nationwide slowdown in residential price growth, a contraction in transactions and new starts, and falling investment. While the previous downturn in 2012 was policy driven in response to concerns about overheating prices, the current weakness has been without any direct tightening of property market policies. Distortions make the property market in China susceptible to both price misalignment and overbuilding. On the supply side, the market is distorted by local governments’ reliance on land sales to finance spending.3 On the demand side, the market is prone to misalignment—housing is attractive as a financial investment instrument given a history of robust capital gains, real deposit interest rates that tended to be negative, a lack of alternative financial assets, as well as capital account restrictions.
Housing inventory indicators from the NBS and FangGuanJu show a buildup of inventory in 2014, the sizes of the inventory in the two datasets are significantly different (Figure 3). Inventory can be measured by the ratio of floor space unsold to floor space sold during the period. Both NBS and FangGuanJu data showed a rapid buildup of inventory since 2013. According to NBS data, the nationwide inventory ratio is only about four months of sales, while FangGuanJu data suggest that the nationwide ratio might have been as high as 24 months in mid-2014. The differences may be attributable to different data collection methodologies. The NBS data rely on developers’ self-reporting and are likely subject to underreporting of unsold units and overreporting of sales; FangGuanJu data record all real estate registrations including buildings that have obtained permits to sell.
The full text of this article is available to MacroBusiness subscribers
David Llewellyn-Smith is Chief Strategist at the MB Fund and MB Super. David is the founding publisher and editor of MacroBusiness and was the founding publisher and global economy editor of The Diplomat, the Asia Pacific’s leading geo-politics and economics portal.
He is also a former gold trader and economic commentator at The Sydney Morning Herald, The Age, the ABC and Business Spectator. He is the co-author of The Great Crash of 2008 with Ross Garnaut and was the editor of the second Garnaut Climate Change Review.

Real estate activity has softened starting in 2014. Available data suggest a nationwide slowdown in residential price growth, a contraction in transactions and new starts, and falling investment. While the previous downturn in 2012 was policy driven in response to concerns about overheating prices, the current weakness has been without any direct tightening of property market policies. Distortions make the property market in China susceptible to both price misalignment and overbuilding. On the supply side, the market is distorted by local governments’ reliance on land sales to finance spending.3 On the demand side, the market is prone to misalignment—housing is attractive as a financial investment instrument given a history of robust capital gains, real deposit interest rates that tended to be negative, a lack of alternative financial assets, as well as capital account restrictions.