The 11th Annual Demographia International Housing Affordability Survey covers 378 metropolitan markets in nine countries (Australia, Canada, China, Ireland, Japan, New Zealand, Singapore, the United Kingdom and the United States). A total of 86 major metropolitan markets — with more than 1,000,000 population — are included, including five of the six largest metropolitan areas in the high income world (Tokyo-Yokohama, New York, Osaka-Kobe-Kyoto, Los Angeles, and London.
This year’s edition includes a comparison with housing affordability indexes by The Economist, for the major metropolitan areas in China (excluding Hong Kong, which is rated in the Demographia Survey) and by Kookmin Bank for South Korea (the Republic of Korea).
Rating Housing Affordability …
The Demographia International Housing Affordability Survey rates housing affordability using the “Median Multiple” in its analysis of Australia, Canada, Hong Kong, Ireland, New Zealand, Singapore, the United Kingdom and the United States. The Median Multiple is widely used for evaluating urban markets, and has been recommended by the World Bank and the United Nations and is used by the Joint Center for Housing Studies, Harvard University. The Median Multiple and other similar price-to-income multiples (housing affordability multiples) are used to compare housing affordability between markets by the Organization for Economic Cooperation and Development, the International Monetary Fund, The Economist, and other organizations.
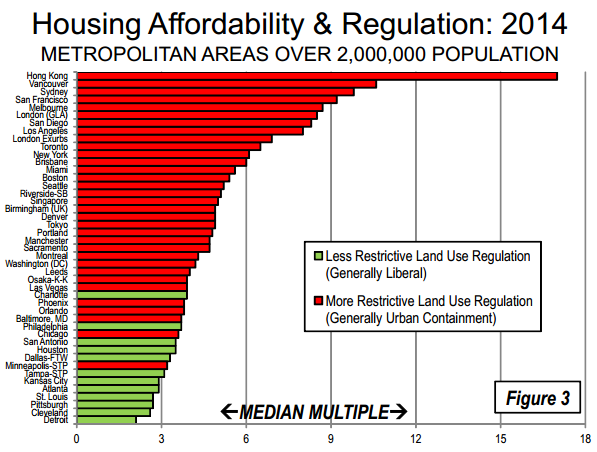
Historically, the Median Multiple has been remarkably similar in Australia, Canada, Ireland, New Zealand, the United Kingdom and the United States, with median house prices from 2.0 to 3.0 times median household incomes. However, in recent decades, house prices have been decoupled from this relationship in a number of markets, such as Vancouver, Sydney, San Francisco, London, Auckland and others. Without exception, these markets have severe land use restrictions (typically “urban containment” policies) that have been associated with higher land prices and in consequence higher house prices (as basic economics would indicate, other things being equal).
Table ES-1
Demographia International Housing Affordability Survey
Housing Affordability Rating Categories
Rating
Median Multiple
Severely Unaffordable
5.1 & Over
Seriously Unaffordable
4.1 to 5.0
Moderately Unaffordable
3.1 to 4.0
Affordable
3.0 & Under
Housing Affordability in 2014 …Major Markets (Population 1 million +)
The most affordable major metropolitan markets in 2014 were in the United States, which had a moderately unaffordable rating of 3.6. Canada and Ireland were rated “seriously unaffordable,” with a Median Multiple of 4.3, along with Japan (4.4), the United Kingdom (4.7) and Singapore (5.0). Australia (6.4), New Zealand (8.2) and Hong Kong (17.0) were severely unaffordable (Table ES-2).
The most affordable major metropolitan markets (Figure ES-1) were in the United States (Figure ES-1), with 14 markets rated as “affordable.” Hong Kong’s Median Multiple of 17.0 was the highest recorded (least affordable) in the 11 years of the Demographia International Housing Affordability Survey. Again, Vancouver was second only to Hong Kong, with a Median Multiple of 10.6. Housing affordability in Sydney deteriorated to a Median Multiple of 9.8, which was followed by San Francisco and San Jose (each 9.2). Melbourne had a Median Multiple of 8.7 and London (Greater London Authority) 8.5. Three other markets had Median Multiples of 8.0 or above, including San Diego (8.3), Auckland (8.2) and Los Angeles (8.0).
Table ES-2
Housing Affordability Ratings by Nation: Major Markets (Over 1,000,000 Population)
Nation
Affordable
(3.0 & Under)
Moderately
Unaffordable (3.1-4.0)
Seriously Unaffordable (4.1-5.0)
Severely Unaffordable (5.1 & Over)
Total
Median
Market
Australia
0
0
0
5
5
6.4
Canada
0
2
2
2
6
4.3
China (Hong Kong)
0
0
0
1
1
17.0
Ireland
0
0
1
0
1
4.3
Japan
0
1
1
0
2
4.4
New Zealand
0
0
0
1
1
8.2
Singapore
0
0
1
0
1
5.0
United Kingdom
0
1
10
6
17
4.7
United States
14
23
6
9
52
3.6
TOTAL
14
27
21
24
86
4.2
Housing Affordability in 2014 … All Markets …
Among all 378 markets in the principal analysis, there were 98 affordable markets, 88 in the United States, five in Canada, three in Ireland and, for the first time, there were affordable markets in Australia (two). There were 119 moderately unaffordable markets, 97 in the United States, 16 in Canada, three in the United Kingdom and one each in Japan, Ireland and Australia. There were 76 seriously unaffordable markets and 85 severely unaffordable markets. Australia had 33 severely unaffordable markets, followed by the United States with 25 and the United Kingdom with 16. New Zealand and Canada each had five severely unaffordable markets, while China’s one market (Hong Kong) was also severely unaffordable (Table ES-3).
Table ES-3
Housing Affordability Ratings by Nation: All Markets
David Llewellyn-Smith is Chief Strategist at the MB Fund and MB Super. David is the founding publisher and editor of MacroBusiness and was the founding publisher and global economy editor of The Diplomat, the Asia Pacific's leading geo-politics and economics portal.
He is also a former gold trader and economic commentator at The Sydney Morning Herald, The Age, the ABC and Business Spectator. He is the co-author of The Great Crash of 2008 with Ross Garnaut and was the editor of the second Garnaut Climate Change Review.