The Melbourne Institute (MI) Inflationary Expectations are now reported as a 30% symmetric trimmed mean utilising all responses except for the ‘don’t know’ responses.
•These changes have added about 2ppt to the level of the index compared to the old trimmed mean (chart 5). But more importantly, the new series appears to express a greater cyclical amplitude (chart 6 & 7) which is useful for picking turning points in the inflation cycle.
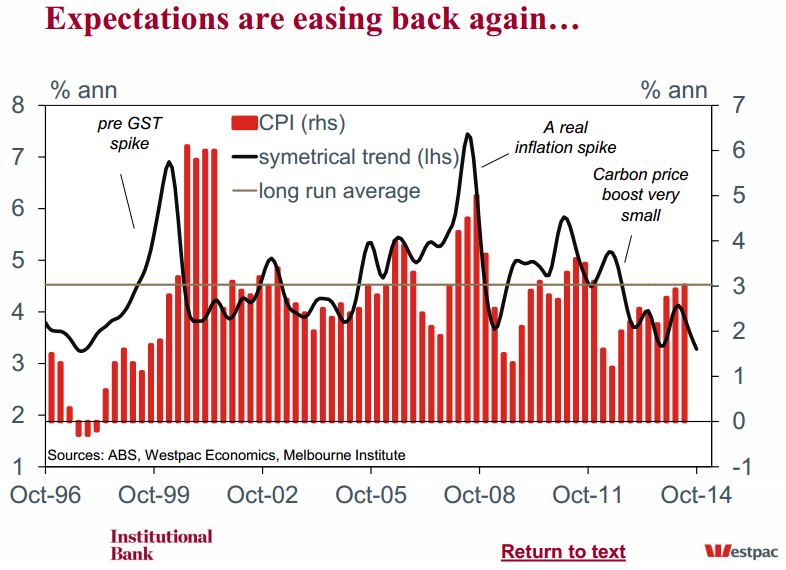
•The consumer expected inflation rate fell by 0.1ppts to 3.4% in Oct. The trend of the trimmed mean series also eased 0.1ppt to 3.3% in Oct.
•The bump up in the trend of expectations, seen through the first half of 2014, has completely faded and we are now back to the lows last seen in Oct and Nov of 2013 (chart 9). Inflationary expectations have clearly eased back; maybe for now, falling petrol prices are more important in the formation of expectations than a falling AUD.
•A closer look at the distribution of responses revealed that the proportion of respondents expecting increases in prices rose to 75.2% from 73.0% in Sep while the proportion of respondents anticipating falls in prices rose to 2.0% from 1.3% in Sep.
•Westpac simplifies this into a net balance which had been on a easing trend since Jun. It did bump a little higher in Oct, 73.2% from 71.7% in Sep but the trend still fell from 73.2% to 72.8% in Oct. As such it appears that the breadth of those expecting price rises continues to moderate. (Chart 11)
•The proportion of respondents (excluding the ‘don’t know’s) that are expecting the inflation rate to fall within the 0-5% range remains relatively unchanged at 78.2%. The weighted mean of responses within the 0-5 per cent range was 2.6% and it has been between 2.5% and 2.7% over the last five months.
•Westpac has found an inverse relationship between the share of those reporting 0% to 5% expected inflation and actual inflation as reported by the CPI. That is, as the share those expecting inflation to fall within that range declines, it is generally association with a pick-up in inflation (chart 12). Very few ever expect prices to fall so a falling share means there a greater share of higher (and sometime extremely high) expectations.
•The trend in this series was 80.5% in Oct, compared to 79.4% in Sep and 78.3% in Aug. It is also significantly higher than the long-run average of 68.2%. Clearly, consumers are increasing seeing a very benign outlook for inflation. While the recent fall the AUD is yet to impact on broader prices in the economy, when (or if) these price pressures do come through via import prices they will be doing so from a very low and well anchor point in inflationary expectations.
•For now, it appears that falling petrol prices may be the bigger factor.
David Llewellyn-Smith is Chief Strategist at the MB Fund and MB Super. David is the founding publisher and editor of MacroBusiness and was the founding publisher and global economy editor of The Diplomat, the Asia Pacific’s leading geo-politics and economics portal.
He is also a former gold trader and economic commentator at The Sydney Morning Herald, The Age, the ABC and Business Spectator. He is the co-author of The Great Crash of 2008 with Ross Garnaut and was the editor of the second Garnaut Climate Change Review.