

Chris Weston, Chief Market Strategist at IG Markets
Since the start of the month, Australian banks have come under strong selling pressure, with the financial sub-sector falling just over 5%. Heavy volumes have accompanied the selling.
Given the 25% weighting the big four banks have on the broader ASX 200, it’s easy to understand why the index has found strong selling pressure of late, breaking key trend support lines in the process.
Since around mid-2012, price action in the banks changed significantly. This was perhaps aided by European Central Bank (ECB) governor Mario Draghi’s promises to ‘do whatever it takes’ to save the Eurozone. The other key catalyst was the fact the market simultaneously caught wind that the Reserve Bank of Australia (RBA) would lower interest rates further. This clearly materialised, with the cash rate cut by another 100 basis points to the current record low of 2.5%.
The key point here is this: when adjusted for inflation, capital gains or tax (in the case of term deposits), many instruments with a maturity of five years or less have a negative ‘real’ return. Similar to what we have seen in Europe, Japan and the US, the Australian central bank has effectively pushed investors into assets that have a positive ‘real’ return (i.e. yields adjusted for inflation). Naturally, when the banks hold a net yield above 5% and stable earnings streams, this is seen as a compelling place to invest.
The question everyone is asking
So, is the so-called ‘yield trade’ now over? Firstly, it has to be said that the RBA won’t be cutting rates anytime soon, nor will they be hiking them either. Given the RBA’s recent inflation forecasts, it makes sense for them to be on hold until well into 2015, which in theory should support the banks as traders can still get dividend income. Still, if we think of the banks as a quasi-bond, we therefore need to compare the banks to other debt instruments like Australian government bonds (AGBs). It’s from here we can see an increasing correlation between selling in AGBs and the banks’ falling share price.
Here we have to look at the Federal Reserve and the market’s belief that the US central bank will raise short-term rates four to five times in 2015, and maybe even a further six times in 2016. These expectations will be tempered on further USD strength, given the influence the currency has on inflation.
Still, it’s hard not to see the rise in expectations of late. If we look at the yield on the US ten-year bond, we have seen strong selling (traders will generally sell bonds when expectations increase around a future interest rate hike) with yields rising from 2.32% at the start of the month to a high of 2.65%. This move in the bond market is central to every asset class.
We live in a world that is now adjusting to the idea that the world’s most influential central bank will tighten policy next year. This is having a major impact on the financial landscape.
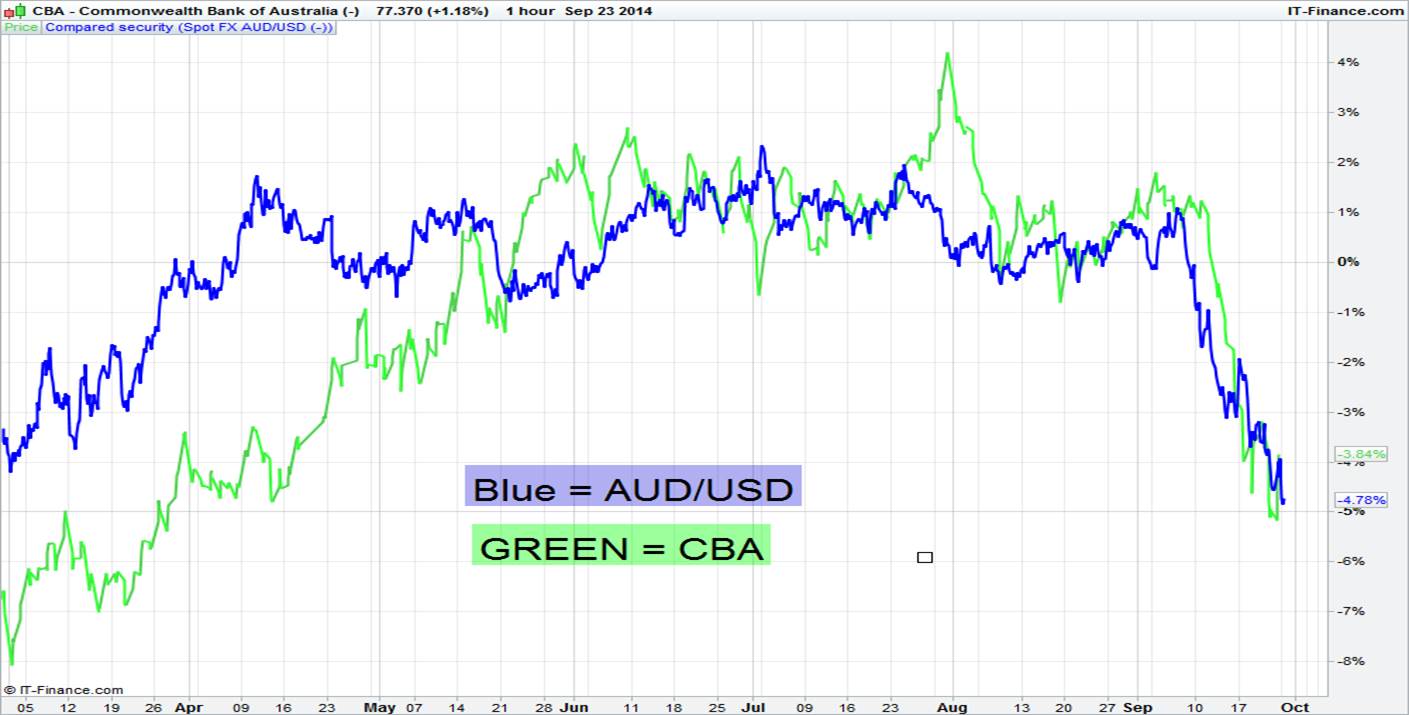
Since 5 September, we have seen the AUD/USD collapse from $0.9402 to the $0.8850 level.
This has been predominantly driven by traders unwinding trades which took advantage of high-yielding assets (which of course Australia provided). However, concerns around China’s growth and the potential for macro-prudential tools being implemented to cool the Australian housing market are also having an influence. The fall in the AUD is having a major knock-on effect on banks’ share prices and here we need to remember just over 40% of the Australian equity market is foreign-owned. So the falling currency acts as a major headwind on portfolios and, while hedging can mitigate this exposure, it’s rarely perfect.
You can see the correlation between AUD/USD and CBA from the hourly chart. With this correlation in mind, we need to take a view on US bonds and also the AUD/USD. The trend is lower in AUD/USD, although, with the 14-day RSI at 24, the pair is grossly oversold. My bias is to sell rallies to the $0.8950 area. However, foreigners are clearly liquidating Australian equities (notably banking stocks), given the free-falling local unit. I also feel US bond yields will continue to rise over a medium-term view, although they are a touch oversold at present. Both these factors suggest the banks have sizeable headwinds.
The technical set-up in the banks is fairly similar, with the daily chart highlighting oversold conditions. However, there really isn’t a clear buy signal yet. The uptrend drawn from the May 2012 low has been broken and this former trend is now showing strong resistance. We can also see strong resistance around A$78.30 – the 38.2% retracement of the recent sell-off, as well as strong horizontal resistance – and it’s at this level I would look to initiate short positions. I would protect my portfolio in case my view was wrong by placing a stop loss at $80.50 (just above the horizontal line seen on the weekly chart).
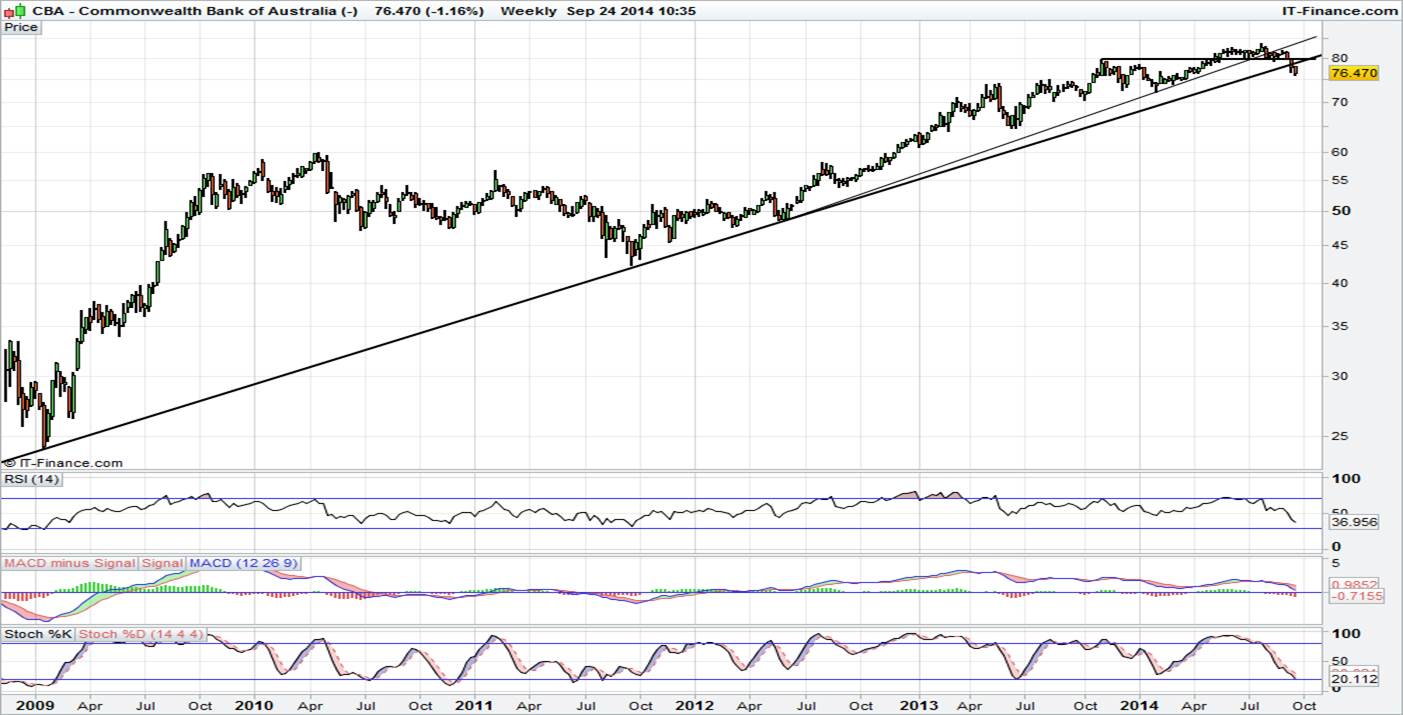
The weekly chart also looks concerning and highlights the fact that rallies appear to be good selling opportunities, with all three oscillators (MACD, stochastic and RSI) all highlighting strong downside momentum.