
Cross-posted from Investing in Chinese Stocks.
In May, the headline was May Home Prices: Accelerating Price Declines. This month, the acceleration picked up speed and broadened nationally. Cities with month-on-month rising prices are now the rare exception. The average price decline doubled from May in cities with falling prices.
Of May I wrote that 35 cities saw price declines and 20 were flat. Most of the latter will probably decline in June. If so, April-May will mark the peak for home prices in this cycle. That is now confirmed.
New home prices were down broadly:
- March: 4 cities saw declines in price month on month (MoM), 10 cities were flat, 56 were up;
- April: 8 cities saw declines in price MoM, 18 cities were flat, 44 were up;
- May: 35 cities saw declines in price MoM, 20 cities were flat, 15 were up;
- June: 55 cities saw declines in price MoM, 7 cities were flat, 8 were up.
Hohhot and Guiyang saw the largest price increases mom of 0.2%; Hohhot was in the news for cancelling buying restrictions in late June.
The largest new home price decline was 1.7% in Hangzhou, followed closely by nearby Ningbo, down 1.5%. The average decline in June among cities will falling prices was 0.6%, double the 0.3% rate in May.
Existing home prices fell broadly as well. 7 cities saw gains, 11 cities were flat and 52 saw declines. In April, only 2 cities were down year on year (YoY); this rose to 5 in May and 8 in June.
There was some variation within the cities: Beijing saw new home prices climb 0.1%, but existing home prices fell 1.3%. In Luoyang, new home prices fell 1.2%, but existing home prices climbed 0.1%.
In April, 44 of the 70 cities saw existing home price declines MoM in at least one area segment (last table below). In May, the number rose to 51 cities. In June, it climbed to 60. For new homes, 58 cities saw at least one segment decline in price.
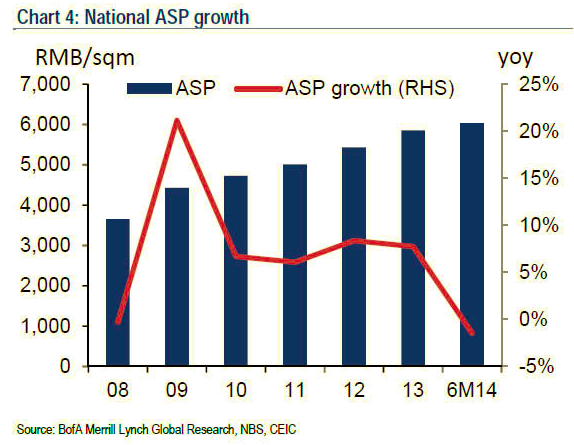
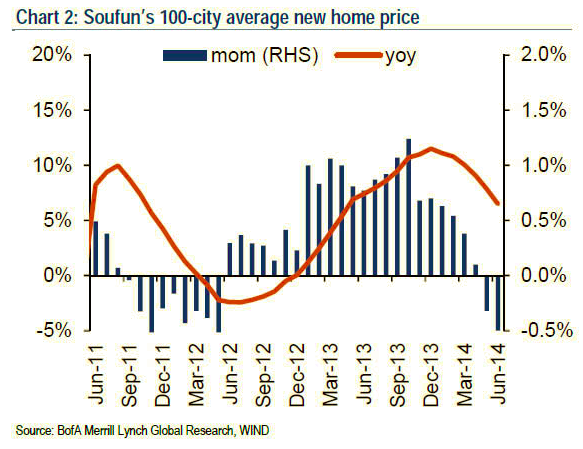
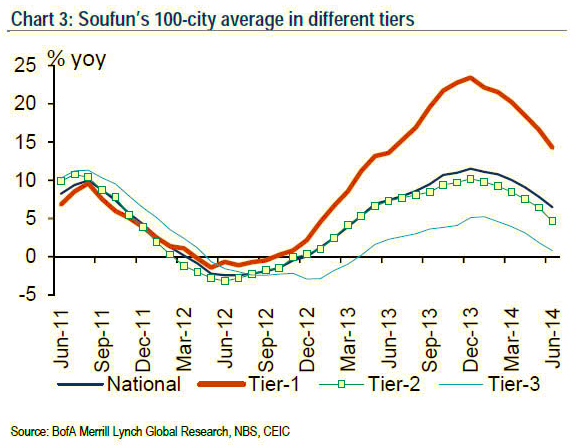
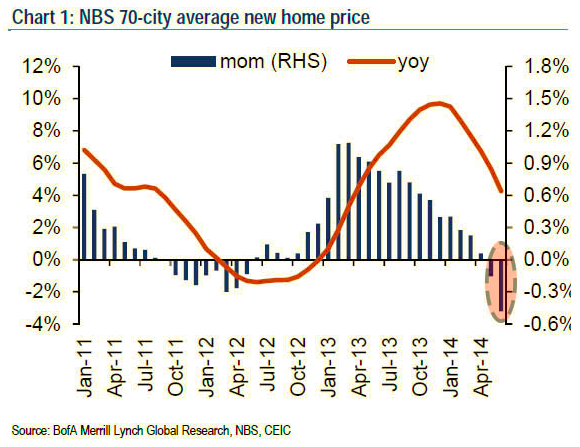
Here are some charts from BofAML illustrating the declines. For
Below is the data for May. The first table is new residential housing. The data is MoM, YoY, and since 2010. The second table is commercially built properties (商品房). The third table is existing homes. The fourth table breaks down the prices changes for 商品房 by sqm. The fifth table does the same for existing homes.
表1:2014年6月70个大中城市新建住宅价格指数
| 城市 | 新建住宅价格指数 | 城市 | 新建住宅价格指数 | ||||||
| 环比 | 同比 | 定基 | 环比 | 同比 | 定基 | ||||
| 上月=100 | 去年同月=100 | 2010年 =100 | 上月=100 | 去年同月=100 | 2010年 =100 | ||||
| 北 京 | 100.1 | 106.4 | 122.6 | 唐 山 | 100.0 | 100.7 | 103.2 | ||
| 天 津 | 99.5 | 103.3 | 112.7 | 秦 皇 岛 | 99.6 | 102.9 | 115.2 | ||
| 石 家 庄 | 100.0 | 104.9 | 120.7 | 包 头 | 99.5 | 102.0 | 112.4 | ||
| 太 原 | 99.6 | 105.9 | 116.1 | 丹 东 | 99.4 | 104.2 | 117.5 | ||
| 呼和浩特 | 100.2 | 106.4 | 116.3 | 锦 州 | 99.2 | 105.1 | 115.9 | ||
| 沈 阳 | 99.1 | 103.6 | 119.8 | 吉 林 | 99.4 | 102.9 | 114.4 | ||
| 大 连 | 100.0 | 104.4 | 118.9 | 牡 丹 江 | 99.9 | 102.0 | 113.4 | ||
| 长 春 | 99.4 | 104.5 | 114.2 | 无 锡 | 99.2 | 100.9 | 105.8 | ||
| 哈 尔 滨 | 100.1 | 104.2 | 114.9 | 扬 州 | 99.7 | 104.2 | 112.2 | ||
| 上 海 | 99.4 | 107.0 | 121.0 | 徐 州 | 99.6 | 103.4 | 112.6 | ||
| 南 京 | 99.5 | 105.1 | 114.0 | 温 州 | 99.7 | 95.0 | 79.3 | ||
| 杭 州 | 98.3 | 100.6 | 98.6 | 金 华 | 99.4 | 102.8 | 103.3 | ||
| 宁 波 | 98.5 | 101.3 | 98.3 | 蚌 埠 | 99.5 | 102.0 | 108.3 | ||
| 合 肥 | 99.6 | 105.7 | 113.9 | 安 庆 | 99.7 | 102.1 | 108.9 | ||
| 福 州 | 99.3 | 105.2 | 120.1 | 泉 州 | 99.0 | 104.2 | 108.3 | ||
| 厦 门 | 100.1 | 109.2 | 127.7 | 九 江 | 99.3 | 102.0 | 109.5 | ||
| 南 昌 | 99.5 | 103.4 | 117.9 | 赣 州 | 99.2 | 104.2 | 113.9 | ||
| 济 南 | 99.3 | 104.6 | 113.4 | 烟 台 | 99.6 | 105.5 | 112.9 | ||
| 青 岛 | 99.4 | 104.6 | 110.3 | 济 宁 | 99.7 | 104.1 | 113.4 | ||
| 郑 州 | 100.0 | 104.8 | 122.2 | 洛 阳 | 98.8 | 104.5 | 116.1 | ||
| 武 汉 | 99.6 | 105.0 | 116.8 | 平 顶 山 | 99.4 | 105.0 | 115.0 | ||
| 长 沙 | 99.1 | 104.8 | 122.0 | 宜 昌 | 99.2 | 103.5 | 114.5 | ||
| 广 州 | 99.4 | 107.7 | 129.3 | 襄 阳 | 99.1 | 102.3 | 114.9 | ||
| 深 圳 | 99.6 | 106.6 | 125.6 | 岳 阳 | 100.0 | 102.9 | 115.1 | ||
| 南 宁 | 99.3 | 104.8 | 112.8 | 常 德 | 99.5 | 103.9 | 113.0 | ||
| 海 口 | 99.4 | 101.2 | 103.1 | 惠 州 | 99.7 | 105.2 | 114.5 | ||
| 重 庆 | 99.2 | 103.9 | 114.1 | 湛 江 | 100.1 | 106.0 | 119.3 | ||
| 成 都 | 99.4 | 103.6 | 114.0 | 韶 关 | 99.3 | 100.8 | 112.4 | ||
| 贵 阳 | 100.2 | 104.3 | 114.8 | 桂 林 | 99.1 | 106.0 | 118.7 | ||
| 昆 明 | 99.5 | 103.4 | 114.3 | 北 海 | 99.5 | 105.6 | 112.5 | ||
| 西 安 | 100.0 | 105.3 | 116.8 | 三 亚 | 99.9 | 104.4 | 107.5 | ||
| 兰 州 | 99.2 | 102.4 | 115.4 | 泸 州 | 99.2 | 106.3 | 113.8 | ||
| 西 宁 | 100.1 | 106.3 | 122.5 | 南 充 | 99.6 | 103.6 | 113.2 | ||
| 银 川 | 100.1 | 105.8 | 115.9 | 遵 义 | 99.7 | 103.8 | 113.8 | ||
| 乌鲁木齐 | 99.6 | 105.5 | 124.7 | 大 理 | 100.0 | 103.6 | 107.6 | ||
| 注:环比以上月价格为100,同比以去年同月价格为100,定基以2010年价格为100。 | |||||||||
| 城市 | 新建商品住宅价格指数 | 城市 | 新建商品住宅价格指数 | ||||||
| 环比 | 同比 | 定基 | 环比 | 同比 | 定基 | ||||
| 上月=100 | 去年同月=100 | 2010年 =100 | 上月=100 | 去年同月=100 | 2010年 =100 | ||||
| 北 京 | 100.1 | 108.0 | 129.3 | 唐 山 | 100.0 | 100.8 | 103.5 | ||
| 天 津 | 99.5 | 103.7 | 114.4 | 秦 皇 岛 | 99.6 | 103.2 | 116.9 | ||
| 石 家 庄 | 100.0 | 105.0 | 121.2 | 包 头 | 99.4 | 102.4 | 113.9 | ||
| 太 原 | 99.6 | 106.1 | 116.7 | 丹 东 | 99.4 | 104.2 | 117.6 | ||
| 呼和浩特 | 100.2 | 106.6 | 116.8 | 锦 州 | 99.2 | 105.1 | 115.9 | ||
| 沈 阳 | 99.1 | 103.7 | 120.4 | 吉 林 | 99.4 | 103.0 | 115.0 | ||
| 大 连 | 100.0 | 104.4 | 119.1 | 牡 丹 江 | 99.9 | 102.0 | 113.5 | ||
| 长 春 | 99.4 | 104.6 | 114.6 | 无 锡 | 99.0 | 101.0 | 106.5 | ||
| 哈 尔 滨 | 100.1 | 104.4 | 115.6 | 扬 州 | 99.7 | 104.4 | 112.6 | ||
| 上 海 | 99.3 | 108.2 | 125.1 | 徐 州 | 99.5 | 103.6 | 113.3 | ||
| 南 京 | 99.4 | 106.6 | 118.5 | 温 州 | 99.7 | 94.7 | 78.1 | ||
| 杭 州 | 98.2 | 100.7 | 98.5 | 金 华 | 99.4 | 102.8 | 103.3 | ||
| 宁 波 | 98.4 | 101.4 | 98.2 | 蚌 埠 | 99.5 | 102.1 | 108.5 | ||
| 合 肥 | 99.6 | 106.2 | 115.0 | 安 庆 | 99.7 | 102.2 | 109.1 | ||
| 福 州 | 99.3 | 105.2 | 120.4 | 泉 州 | 99.0 | 104.4 | 108.7 | ||
| 厦 门 | 100.1 | 109.4 | 128.5 | 九 江 | 99.3 | 102.1 | 109.9 | ||
| 南 昌 | 99.5 | 103.5 | 118.6 | 赣 州 | 99.2 | 104.2 | 114.0 | ||
| 济 南 | 99.3 | 104.6 | 113.4 | 烟 台 | 99.6 | 105.5 | 113.1 | ||
| 青 岛 | 99.4 | 104.8 | 110.8 | 济 宁 | 99.6 | 104.2 | 113.8 | ||
| 郑 州 | 100.0 | 105.0 | 122.8 | 洛 阳 | 98.8 | 104.6 | 116.4 | ||
| 武 汉 | 99.5 | 105.2 | 117.7 | 平 顶 山 | 99.4 | 105.1 | 115.2 | ||
| 长 沙 | 99.1 | 104.8 | 122.3 | 宜 昌 | 99.2 | 103.5 | 114.7 | ||
| 广 州 | 99.4 | 107.7 | 129.7 | 襄 阳 | 99.1 | 102.4 | 115.0 | ||
| 深 圳 | 99.6 | 106.7 | 126.1 | 岳 阳 | 100.0 | 104.5 | 121.2 | ||
| 南 宁 | 99.3 | 104.9 | 113.1 | 常 德 | 99.5 | 103.9 | 113.1 | ||
| 海 口 | 99.4 | 101.3 | 103.1 | 惠 州 | 99.7 | 105.2 | 114.6 | ||
| 重 庆 | 99.2 | 103.9 | 114.4 | 湛 江 | 100.1 | 106.0 | 119.3 | ||
| 成 都 | 99.4 | 103.7 | 114.1 | 韶 关 | 99.3 | 100.8 | 112.8 | ||
| 贵 阳 | 100.2 | 104.7 | 116.1 | 桂 林 | 99.1 | 106.1 | 119.1 | ||
| 昆 明 | 99.4 | 104.1 | 116.5 | 北 海 | 99.5 | 105.6 | 112.6 | ||
| 西 安 | 100.0 | 105.9 | 118.6 | 三 亚 | 99.9 | 104.4 | 107.6 | ||
| 兰 州 | 99.2 | 102.4 | 115.7 | 泸 州 | 99.2 | 106.5 | 114.3 | ||
| 西 宁 | 100.1 | 106.4 | 122.5 | 南 充 | 99.6 | 103.7 | 113.4 | ||
| 银 川 | 100.1 | 106.2 | 117.0 | 遵 义 | 99.7 | 104.2 | 115.5 | ||
| 乌鲁木齐 | 99.6 | 105.5 | 124.9 | 大 理 | 100.0 | 103.9 | 108.2 | ||
| 城市 | 二手住宅价格指数 | 城市 | 二手住宅价格指数 | ||||||
| 环比 | 同比 | 定基 | 环比 | 同比 | 定基 | ||||
| 上月=100 | 去年同月=100 | 2010年 =100 | 上月=100 | 去年同月=100 | 2010年 =100 | ||||
| 北 京 | 98.7 | 104.7 | 117.6 | 唐 山 | 99.7 | 100.3 | 104.0 | ||
| 天 津 | 100.0 | 103.9 | 108.7 | 秦 皇 岛 | 99.2 | 98.5 | 101.9 | ||
| 石 家 庄 | 100.1 | 102.4 | 101.7 | 包 头 | 99.4 | 101.5 | 102.7 | ||
| 太 原 | 100.1 | 102.7 | 116.7 | 丹 东 | 99.6 | 101.9 | 105.7 | ||
| 呼和浩特 | 99.6 | 101.2 | 107.2 | 锦 州 | 99.6 | 101.1 | 101.8 | ||
| 沈 阳 | 99.7 | 104.2 | 110.6 | 吉 林 | 99.5 | 99.7 | 104.2 | ||
| 大 连 | 99.6 | 100.4 | 107.8 | 牡 丹 江 | 98.5 | 96.6 | 99.4 | ||
| 长 春 | 99.8 | 102.2 | 105.8 | 无 锡 | 99.6 | 100.8 | 106.9 | ||
| 哈 尔 滨 | 100.0 | 103.9 | 104.4 | 扬 州 | 100.1 | 101.8 | 102.2 | ||
| 上 海 | 99.3 | 105.0 | 116.7 | 徐 州 | 99.7 | 100.4 | 99.8 | ||
| 南 京 | 99.7 | 104.4 | 106.7 | 温 州 | 98.8 | 90.4 | 78.0 | ||
| 杭 州 | 99.1 | 98.5 | 95.2 | 金 华 | 99.4 | 100.9 | 96.8 | ||
| 宁 波 | 99.3 | 100.5 | 95.2 | 蚌 埠 | 99.6 | 103.5 | 109.6 | ||
| 合 肥 | 99.5 | 105.9 | 108.2 | 安 庆 | 99.6 | 100.1 | 100.5 | ||
| 福 州 | 99.3 | 104.1 | 103.9 | 泉 州 | 99.5 | 102.4 | 99.9 | ||
| 厦 门 | 99.8 | 106.2 | 113.5 | 九 江 | 99.6 | 100.9 | 103.9 | ||
| 南 昌 | 99.5 | 103.3 | 106.8 | 赣 州 | 99.6 | 99.9 | 99.5 | ||
| 济 南 | 99.7 | 102.1 | 106.0 | 烟 台 | 99.7 | 103.2 | 104.5 | ||
| 青 岛 | 99.6 | 101.0 | 103.1 | 济 宁 | 99.7 | 100.7 | 108.3 | ||
| 郑 州 | 100.0 | 106.8 | 114.1 | 洛 阳 | 100.1 | 105.3 | 114.3 | ||
| 武 汉 | 99.6 | 104.6 | 111.1 | 平 顶 山 | 100.0 | 103.8 | 112.5 | ||
| 长 沙 | 100.0 | 104.2 | 109.6 | 宜 昌 | 99.8 | 103.2 | 108.9 | ||
| 广 州 | 99.7 | 107.4 | 121.3 | 襄 阳 | 99.7 | 103.2 | 115.4 | ||
| 深 圳 | 99.4 | 109.1 | 123.3 | 岳 阳 | 100.0 | 102.9 | 115.6 | ||
| 南 宁 | 100.0 | 101.6 | 106.5 | 常 德 | 99.9 | 102.3 | 114.5 | ||
| 海 口 | 99.6 | 99.5 | 94.6 | 惠 州 | 99.5 | 104.7 | 112.3 | ||
| 重 庆 | 99.5 | 102.2 | 105.0 | 湛 江 | 99.8 | 102.8 | 111.5 | ||
| 成 都 | 99.5 | 102.4 | 104.3 | 韶 关 | 99.3 | 101.4 | 109.1 | ||
| 贵 阳 | 100.1 | 106.1 | 119.8 | 桂 林 | 100.0 | 101.6 | 106.1 | ||
| 昆 明 | 100.0 | 103.1 | 116.0 | 北 海 | 99.6 | 102.4 | 107.9 | ||
| 西 安 | 99.7 | 101.1 | 105.5 | 三 亚 | 99.9 | 101.6 | 96.4 | ||
| 兰 州 | 99.8 | 101.9 | 101.2 | 泸 州 | 99.6 | 104.1 | 106.1 | ||
| 西 宁 | 100.1 | 102.1 | 112.9 | 南 充 | 99.8 | 103.2 | 106.5 | ||
| 银 川 | 100.0 | 105.8 | 112.9 | 遵 义 | 100.1 | 102.3 | 112.5 | ||
| 乌鲁木齐 | 100.0 | 104.2 | 114.3 | 大 理 | 99.8 | 99.6 | 103.7 | ||
| 城市 | 90m2及以下 | 90-144m2 | 144m2以上 | ||||||
| 环比 | 同比 | 定基 | 环比 | 同比 | 定基 | 环比 | 同比 | 定基 | |
| 上月 =100 | 去年同月 =100 | 2010年 =100 | 上月 =100 | 去年同月 =100 | 2010年 =100 | 上月 =100 | 去年同月 =100 | 2010年 =100 | |
| 北 京 | 100.2 | 108.2 | 130.8 | 100.0 | 107.8 | 128.9 | 100.1 | 108.0 | 128.4 |
| 天 津 | 99.6 | 103.4 | 116.5 | 99.5 | 104.1 | 113.6 | 99.3 | 103.5 | 113.5 |
| 石 家 庄 | 100.1 | 105.9 | 121.9 | 100.0 | 104.6 | 121.7 | 100.1 | 105.2 | 119.5 |
| 太 原 | 99.7 | 107.2 | 118.3 | 99.7 | 106.7 | 118.8 | 99.5 | 105.0 | 113.8 |
| 呼和浩特 | 100.2 | 107.2 | 118.1 | 100.1 | 105.9 | 114.9 | 100.3 | 107.1 | 118.5 |
| 沈 阳 | 99.3 | 103.8 | 123.3 | 99.0 | 103.7 | 119.2 | 98.9 | 103.3 | 116.2 |
| 大 连 | 100.0 | 103.8 | 118.9 | 100.0 | 105.3 | 119.9 | 100.1 | 104.2 | 117.9 |
| 长 春 | 99.3 | 104.2 | 119.4 | 99.4 | 105.4 | 114.7 | 99.3 | 104.0 | 109.1 |
| 哈 尔 滨 | 100.1 | 104.8 | 117.2 | 100.2 | 104.2 | 115.2 | 100.0 | 104.3 | 114.1 |
| 上 海 | 99.6 | 109.2 | 129.7 | 99.5 | 108.2 | 124.6 | 99.0 | 107.7 | 123.3 |
| 南 京 | 99.6 | 106.6 | 118.3 | 99.5 | 106.5 | 118.8 | 99.0 | 106.8 | 118.1 |
| 杭 州 | 97.9 | 98.5 | 98.1 | 98.4 | 101.6 | 98.5 | 98.5 | 102.0 | 98.8 |
| 宁 波 | 97.7 | 99.4 | 97.7 | 98.5 | 101.5 | 97.3 | 98.5 | 102.0 | 99.1 |
| 合 肥 | 99.8 | 105.9 | 117.6 | 99.6 | 106.5 | 114.5 | 99.1 | 105.6 | 111.2 |
| 福 州 | 98.9 | 104.6 | 119.5 | 99.2 | 104.8 | 122.2 | 99.7 | 106.0 | 118.9 |
| 厦 门 | 100.2 | 110.0 | 132.4 | 100.0 | 110.3 | 130.0 | 100.1 | 107.9 | 124.2 |
| 南 昌 | 99.4 | 103.5 | 117.5 | 99.5 | 103.6 | 120.1 | 99.6 | 103.4 | 116.3 |
| 济 南 | 99.2 | 105.1 | 117.3 | 99.3 | 104.0 | 113.2 | 99.4 | 105.5 | 112.1 |
| 青 岛 | 99.3 | 104.1 | 109.9 | 99.6 | 105.3 | 112.7 | 99.2 | 104.7 | 108.4 |
| 郑 州 | 100.1 | 105.2 | 124.4 | 100.0 | 103.8 | 121.2 | 100.0 | 105.9 | 122.4 |
| 武 汉 | 99.6 | 105.5 | 118.8 | 99.5 | 104.8 | 117.9 | 99.5 | 105.8 | 115.6 |
| 长 沙 | 99.3 | 104.9 | 125.3 | 99.3 | 104.2 | 122.2 | 98.6 | 105.5 | 119.7 |
| 广 州 | 99.3 | 108.0 | 130.1 | 99.5 | 108.5 | 132.7 | 99.3 | 106.8 | 126.1 |
| 深 圳 | 99.7 | 107.1 | 129.3 | 99.5 | 107.6 | 124.8 | 99.5 | 105.9 | 123.8 |
| 南 宁 | 99.5 | 104.7 | 113.5 | 99.3 | 104.7 | 113.0 | 98.9 | 105.6 | 112.5 |
| 海 口 | 99.7 | 102.0 | 106.4 | 99.6 | 101.6 | 103.1 | 98.9 | 100.5 | 102.0 |
| 重 庆 | 99.3 | 103.6 | 117.3 | 99.1 | 103.6 | 112.8 | 99.0 | 104.9 | 112.7 |
| 成 都 | 99.3 | 103.1 | 113.6 | 99.5 | 104.3 | 116.5 | 99.6 | 103.5 | 111.3 |
| 贵 阳 | 100.1 | 105.7 | 118.5 | 100.2 | 104.4 | 115.9 | 100.3 | 104.8 | 114.8 |
| 昆 明 | 99.5 | 104.6 | 119.6 | 99.4 | 104.1 | 116.4 | 99.5 | 103.5 | 112.6 |
| 西 安 | 100.0 | 105.8 | 121.6 | 100.1 | 105.0 | 116.5 | 99.8 | 107.7 | 117.9 |
| 兰 州 | 99.0 | 102.3 | 115.6 | 99.4 | 102.7 | 115.3 | 98.7 | 101.8 | 116.8 |
| 西 宁 | 100.3 | 106.5 | 122.1 | 100.1 | 106.3 | 122.9 | 100.1 | 106.3 | 121.4 |
| 银 川 | 100.1 | 107.2 | 120.2 | 100.2 | 105.9 | 114.8 | 100.1 | 105.4 | 116.9 |
| 乌鲁木齐 | 99.5 | 107.1 | 126.5 | 99.7 | 104.8 | 126.4 | 99.5 | 104.4 | 118.9 |
| 唐 山 | 100.0 | 102.0 | 105.3 | 100.0 | 100.5 | 103.6 | 99.9 | 99.9 | 100.9 |
| 秦 皇 岛 | 99.4 | 103.5 | 118.7 | 99.7 | 102.9 | 115.8 | 100.0 | 103.0 | 115.4 |
| 包 头 | 100.0 | 103.3 | 115.2 | 99.0 | 102.5 | 114.7 | 99.4 | 99.8 | 108.5 |
| 丹 东 | 99.9 | 105.0 | 120.1 | 99.1 | 103.8 | 117.1 | 98.7 | 103.3 | 113.1 |
| 锦 州 | 99.4 | 105.2 | 116.5 | 99.0 | 105.1 | 116.4 | 99.0 | 105.1 | 111.5 |
| 吉 林 | 99.4 | 102.4 | 115.1 | 99.4 | 103.0 | 114.8 | 99.5 | 104.1 | 115.7 |
| 牡 丹 江 | 100.0 | 102.0 | 113.4 | 99.9 | 102.2 | 113.9 | 99.8 | 100.6 | 113.4 |
| 无 锡 | 99.3 | 100.6 | 108.5 | 99.2 | 101.7 | 107.0 | 98.7 | 100.3 | 104.6 |
| 扬 州 | 99.7 | 104.8 | 114.7 | 99.7 | 104.1 | 112.4 | 99.5 | 104.8 | 112.4 |
| 徐 州 | 99.5 | 102.4 | 111.8 | 99.6 | 103.6 | 114.0 | 99.3 | 105.3 | 112.0 |
| 温 州 | 99.9 | 93.9 | 80.4 | 100.0 | 94.3 | 81.5 | 99.6 | 94.9 | 76.9 |
| 金 华 | 99.7 | 104.5 | 111.6 | 99.5 | 102.9 | 105.7 | 99.2 | 102.2 | 99.1 |
| 蚌 埠 | 99.6 | 104.4 | 112.3 | 99.5 | 101.1 | 107.0 | 99.2 | 103.5 | 109.8 |
| 安 庆 | 99.7 | 102.6 | 111.7 | 99.9 | 102.1 | 109.1 | 99.2 | 102.5 | 108.6 |
| 泉 州 | 98.8 | 104.2 | 109.1 | 99.3 | 104.9 | 110.3 | 98.6 | 103.7 | 105.8 |
| 九 江 | 99.4 | 102.0 | 110.3 | 99.3 | 102.7 | 111.2 | 99.0 | 100.6 | 104.7 |
| 赣 州 | 99.7 | 104.9 | 113.6 | 99.1 | 104.5 | 114.6 | 99.2 | 103.3 | 113.1 |
| 烟 台 | 99.9 | 105.5 | 112.8 | 99.5 | 106.3 | 114.9 | 99.4 | 103.1 | 107.8 |
| 济 宁 | 99.9 | 105.6 | 115.4 | 99.5 | 104.3 | 114.8 | 99.6 | 102.9 | 109.9 |
| 洛 阳 | 99.3 | 106.5 | 122.0 | 98.8 | 103.1 | 114.0 | 98.5 | 104.8 | 115.1 |
| 平 顶 山 | 99.7 | 105.6 | 117.1 | 99.4 | 106.5 | 118.2 | 99.0 | 102.2 | 108.2 |
| 宜 昌 | 99.3 | 104.7 | 115.2 | 99.2 | 103.2 | 115.0 | 99.1 | 103.7 | 113.0 |
| 襄 阳 | 98.8 | 102.1 | 116.7 | 99.2 | 102.6 | 115.9 | 99.1 | 101.9 | 111.1 |
| 岳 阳 | 100.0 | 104.7 | 121.7 | 100.1 | 105.0 | 123.2 | 100.0 | 104.1 | 119.8 |
| 常 德 | 99.3 | 105.4 | 117.3 | 99.5 | 103.6 | 112.2 | 99.9 | 104.3 | 114.0 |
| 惠 州 | 99.7 | 107.8 | 122.6 | 99.6 | 104.3 | 115.2 | 99.7 | 104.7 | 110.6 |
| 湛 江 | 100.0 | 105.8 | 119.0 | 100.3 | 106.3 | 121.3 | 100.2 | 106.1 | 116.5 |
| 韶 关 | 99.7 | 101.2 | 114.6 | 99.1 | 100.7 | 111.9 | 99.7 | 99.2 | 107.1 |
| 桂 林 | 99.2 | 106.2 | 117.8 | 99.1 | 106.5 | 121.3 | 98.9 | 104.7 | 111.6 |
| 北 海 | 99.6 | 105.6 | 112.5 | 99.3 | 106.0 | 114.2 | 99.2 | 104.6 | 107.3 |
| 三 亚 | 99.9 | 104.4 | 107.7 | 99.8 | 104.5 | 108.3 | 100.0 | 104.3 | 106.7 |
| 泸 州 | 99.2 | 106.1 | 113.4 | 99.1 | 106.6 | 114.7 | 99.6 | 106.1 | 113.4 |
| 南 充 | 99.5 | 103.0 | 112.3 | 99.6 | 104.0 | 113.9 | 99.8 | 103.5 | 113.1 |
| 遵 义 | 99.3 | 104.4 | 116.0 | 99.9 | 103.9 | 115.6 | 99.7 | 104.8 | 114.8 |
| 大 理 | 100.3 | 103.8 | 107.7 | 99.9 | 104.0 | 107.5 | 100.0 | 103.9 | 109.8 |
| 城市 | 90m2及以下 | 90-144m2 | 144m2以上 | ||||||
| 环比 | 同比 | 定基 | 环比 | 同比 | 定基 | 环比 | 同比 | 定基 | |
| 上月 =100 | 去年同月 =100 | 2010年 =100 | 上月=100 | 去年同月 =100 | 2010年 =100 | 上月 =100 | 去年同月 =100 | 2010年 =100 | |
| 北 京 | 98.8 | 104.7 | 119.2 | 98.7 | 104.9 | 117.1 | 98.7 | 104.6 | 114.4 |
| 天 津 | 100.1 | 104.5 | 111.6 | 100.0 | 103.6 | 109.8 | 99.8 | 101.8 | 100.7 |
| 石 家 庄 | 100.1 | 102.4 | 101.8 | 100.0 | 102.4 | 102.8 | 99.9 | 102.0 | 96.7 |
| 太 原 | 100.1 | 103.1 | 118.5 | 100.1 | 102.6 | 115.6 | 100.0 | 101.8 | 113.9 |
| 呼和浩特 | 99.6 | 101.3 | 107.4 | 99.8 | 101.5 | 108.2 | 99.6 | 100.2 | 104.6 |
| 沈 阳 | 99.8 | 104.5 | 111.5 | 99.5 | 103.6 | 109.9 | 100.0 | 103.8 | 106.5 |
| 大 连 | 99.5 | 100.7 | 107.9 | 99.7 | 99.3 | 106.7 | 99.7 | 102.5 | 110.7 |
| 长 春 | 99.8 | 102.7 | 108.1 | 99.8 | 101.4 | 103.6 | 99.7 | 102.3 | 102.7 |
| 哈 尔 滨 | 100.0 | 104.2 | 104.5 | 100.1 | 104.7 | 105.5 | 99.7 | 102.1 | 102.5 |
| 上 海 | 99.4 | 105.8 | 119.5 | 99.2 | 104.5 | 116.4 | 99.2 | 103.5 | 110.5 |
| 南 京 | 99.8 | 105.4 | 106.0 | 99.9 | 103.6 | 105.0 | 99.5 | 104.3 | 110.3 |
| 杭 州 | 99.1 | 99.6 | 97.4 | 99.3 | 98.3 | 95.6 | 98.5 | 94.2 | 85.9 |
| 宁 波 | 99.4 | 100.6 | 96.0 | 99.5 | 100.5 | 94.6 | 98.6 | 100.3 | 93.5 |
| 合 肥 | 99.9 | 106.7 | 110.9 | 99.4 | 105.3 | 107.5 | 99.6 | 107.2 | 106.3 |
| 福 州 | 99.3 | 105.0 | 104.7 | 99.1 | 104.6 | 106.1 | 99.6 | 102.7 | 102.7 |
| 厦 门 | 99.7 | 106.3 | 116.4 | 99.8 | 107.0 | 114.9 | 99.9 | 104.7 | 107.9 |
| 南 昌 | 99.9 | 104.0 | 110.9 | 99.1 | 102.6 | 102.9 | 99.4 | 103.0 | 104.5 |
| 济 南 | 99.6 | 101.7 | 103.7 | 99.7 | 102.5 | 107.6 | 99.9 | 102.8 | 110.1 |
| 青 岛 | 99.7 | 102.8 | 104.6 | 99.5 | 99.9 | 102.0 | 99.5 | 99.7 | 102.5 |
| 郑 州 | 100.1 | 107.8 | 116.0 | 99.9 | 106.8 | 113.2 | 100.1 | 105.4 | 112.9 |
| 武 汉 | 99.5 | 104.3 | 111.1 | 99.7 | 104.8 | 112.0 | 99.5 | 104.5 | 108.3 |
| 长 沙 | 100.1 | 102.7 | 108.8 | 100.0 | 104.8 | 110.4 | 100.1 | 105.8 | 109.3 |
| 广 州 | 99.8 | 107.3 | 124.7 | 100.0 | 107.3 | 119.9 | 99.3 | 107.7 | 116.3 |
| 深 圳 | 99.3 | 111.3 | 127.1 | 99.6 | 107.7 | 124.7 | 99.6 | 105.7 | 111.0 |
| 南 宁 | 100.1 | 101.9 | 107.1 | 99.8 | 101.4 | 107.8 | 100.1 | 101.4 | 102.6 |
| 海 口 | 99.6 | 100.0 | 95.2 | 99.5 | 99.9 | 95.0 | 99.7 | 98.6 | 93.4 |
| 重 庆 | 99.6 | 102.7 | 102.8 | 99.5 | 102.1 | 106.4 | 99.0 | 100.7 | 107.6 |
| 成 都 | 99.7 | 102.2 | 104.9 | 99.2 | 102.2 | 102.9 | 99.6 | 103.4 | 105.3 |
| 贵 阳 | 100.1 | 107.2 | 121.0 | 99.9 | 103.7 | 116.8 | 100.2 | 104.7 | 120.3 |
| 昆 明 | 100.1 | 103.2 | 118.1 | 100.1 | 103.9 | 115.6 | 99.7 | 101.7 | 113.6 |
| 西 安 | 99.8 | 100.9 | 107.4 | 99.6 | 101.2 | 103.8 | 99.8 | 102.0 | 107.4 |
| 兰 州 | 100.1 | 101.5 | 100.5 | 99.7 | 102.1 | 101.1 | 99.8 | 101.7 | 102.8 |
| 西 宁 | 100.1 | 102.3 | 114.1 | 100.0 | 101.9 | 111.7 | 100.0 | 102.0 | 110.0 |
| 银 川 | 100.0 | 105.6 | 112.4 | 100.0 | 106.1 | 113.3 | 100.2 | 105.5 | 113.0 |
| 乌鲁木齐 | 100.1 | 104.7 | 117.6 | 100.0 | 104.1 | 112.6 | 100.0 | 101.9 | 109.2 |
| 唐 山 | 99.6 | 100.4 | 104.5 | 100.0 | 99.8 | 102.4 | 100.0 | 100.6 | 101.4 |
| 秦 皇 岛 | 99.1 | 98.3 | 103.3 | 99.3 | 98.5 | 99.5 | 99.4 | 99.6 | 101.4 |
| 包 头 | 99.5 | 102.5 | 102.8 | 99.4 | 100.4 | 103.7 | 99.0 | 101.2 | 98.4 |
| 丹 东 | 99.6 | 102.2 | 108.2 | 99.7 | 101.9 | 104.1 | 99.1 | 100.6 | 100.2 |
| 锦 州 | 99.6 | 101.2 | 100.8 | 99.7 | 101.4 | 102.6 | 99.0 | 99.5 | 107.0 |
| 吉 林 | 99.3 | 99.9 | 105.9 | 99.6 | 99.8 | 104.7 | 99.7 | 99.0 | 98.6 |
| 牡 丹 江 | 98.6 | 95.6 | 100.0 | 98.2 | 99.3 | 99.0 | 99.0 | 99.3 | 96.3 |
| 无 锡 | 99.7 | 101.4 | 106.3 | 99.4 | 100.6 | 107.0 | 99.7 | 100.0 | 108.1 |
| 扬 州 | 100.3 | 102.4 | 102.9 | 99.9 | 101.5 | 101.8 | 99.9 | 100.0 | 100.1 |
| 徐 州 | 99.7 | 100.5 | 99.8 | 99.8 | 100.0 | 99.3 | 99.7 | 101.6 | 101.4 |
| 温 州 | 98.6 | 91.3 | 80.9 | 98.8 | 92.0 | 78.2 | 98.9 | 87.9 | 75.3 |
| 金 华 | 99.5 | 101.5 | 98.4 | 99.5 | 101.7 | 97.6 | 98.8 | 97.9 | 92.3 |
| 蚌 埠 | 99.7 | 104.4 | 110.6 | 99.5 | 102.4 | 108.4 | 99.9 | 102.2 | 107.9 |
| 安 庆 | 99.7 | 100.1 | 100.4 | 99.5 | 99.8 | 100.6 | 99.8 | 100.7 | 101.3 |
| 泉 州 | 99.4 | 102.1 | 99.1 | 99.7 | 102.8 | 100.7 | 99.4 | 102.0 | 100.0 |
| 九 江 | 99.5 | 101.2 | 104.8 | 99.8 | 101.1 | 102.5 | 99.6 | 97.7 | 103.9 |
| 赣 州 | 99.8 | 99.3 | 99.6 | 99.5 | 100.7 | 100.2 | 99.5 | 99.0 | 98.3 |
| 烟 台 | 99.7 | 102.9 | 106.4 | 99.7 | 104.3 | 106.6 | 99.9 | 102.5 | 99.9 |
| 济 宁 | 99.6 | 101.2 | 111.5 | 99.7 | 101.2 | 107.4 | 99.5 | 97.3 | 102.7 |
| 洛 阳 | 100.3 | 106.9 | 116.5 | 99.9 | 104.4 | 113.3 | 100.2 | 104.5 | 113.0 |
| 平 顶 山 | 100.1 | 104.3 | 117.3 | 99.9 | 103.6 | 110.1 | 100.1 | 102.2 | 101.1 |
| 宜 昌 | 99.6 | 103.4 | 108.1 | 99.8 | 103.4 | 109.6 | 99.9 | 102.0 | 106.4 |
| 襄 阳 | 99.4 | 102.1 | 117.0 | 99.7 | 104.5 | 117.0 | 99.8 | 102.1 | 112.3 |
| 岳 阳 | 99.9 | 102.8 | 114.8 | 100.0 | 103.5 | 116.2 | 100.1 | 102.7 | 114.9 |
| 常 德 | 100.0 | 102.4 | 118.2 | 99.9 | 102.3 | 116.1 | 99.9 | 102.3 | 107.9 |
| 惠 州 | 99.4 | 104.4 | 113.1 | 99.7 | 105.3 | 110.1 | 99.8 | 104.4 | 113.5 |
| 湛 江 | 99.9 | 103.2 | 111.3 | 99.6 | 103.6 | 114.1 | 99.9 | 101.3 | 108.3 |
| 韶 关 | 99.7 | 101.8 | 107.3 | 99.0 | 101.2 | 111.6 | 99.2 | 101.2 | 105.8 |
| 桂 林 | 100.2 | 101.9 | 106.5 | 99.8 | 101.5 | 106.6 | 99.4 | 100.5 | 102.4 |
| 北 海 | 99.7 | 102.9 | 108.4 | 99.4 | 101.5 | 107.3 | 99.5 | 101.3 | 105.7 |
| 三 亚 | 100.0 | 102.5 | 97.5 | 99.9 | 101.7 | 96.3 | 99.9 | 100.6 | 95.2 |
| 泸 州 | 99.6 | 104.0 | 106.4 | 99.6 | 104.5 | 105.8 | 99.8 | 103.2 | 106.3 |
| 南 充 | 99.9 | 103.0 | 106.8 | 99.7 | 103.5 | 106.2 | 100.0 | 103.1 | 106.0 |
| 遵 义 | 100.1 | 103.2 | 110.7 | 100.0 | 102.1 | 114.0 | 100.0 | 100.3 | 111.2 |
| 大 理 | 99.6 | 100.1 | 105.2 | 100.0 | 98.9 | 102.0 | 100.0 | 99.8 | 104.5
P |
