The Australian dollar caught a break last night and fell to 93.3 cents as US inflation turned out one for the books (charts from Calculated Risk):
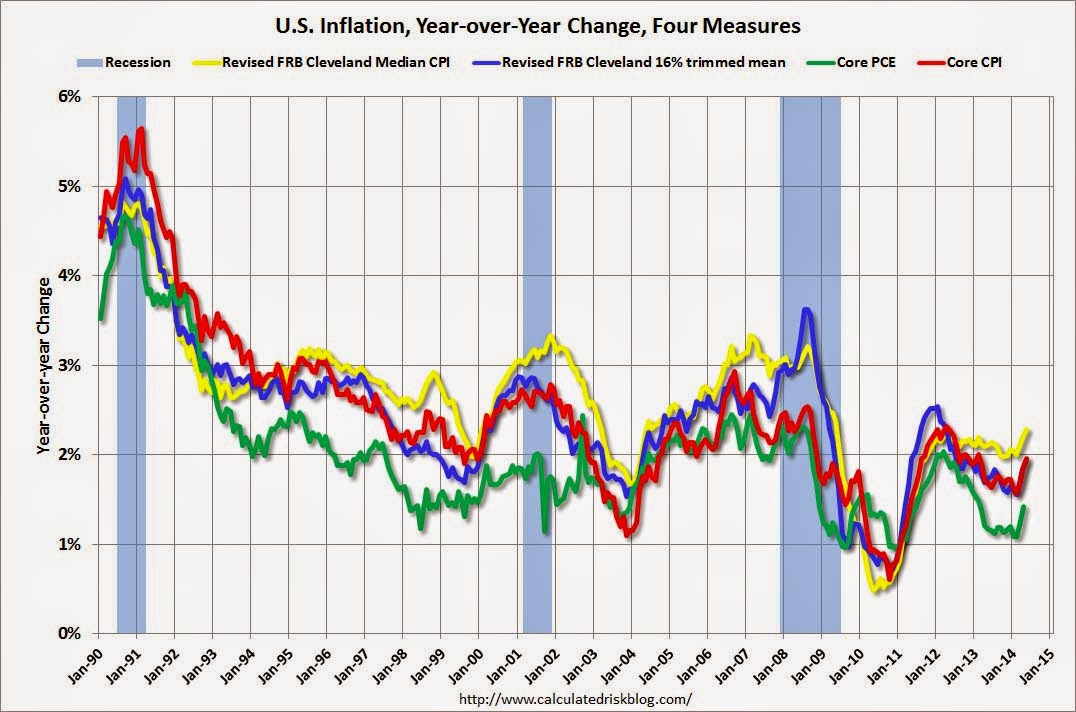
According to the Federal Reserve Bank of Cleveland, the median Consumer Price Index rose 0.3% (3.2% annualized rate) in May. The 16% trimmed-mean Consumer Price Index also increased 0.3% (3.2% annualized rate) during the month. The median CPI and 16% trimmed-mean CPI are measures of core inflation calculated by the Federal Reserve Bank of Cleveland based on data released in the Bureau of Labor Statistics’ (BLS) monthly CPI report.
Earlier today, the BLS reported that the seasonally adjusted CPI for all urban consumers rose 0.4% (4.3% annualized rate) in May. The CPI less food and energy increased 0.3% (3.1% annualized rate) on a seasonally adjusted basis.
That’s a pop all right and relatively broad based as well. The Fed’s preferred measure is the line in green so it’s not panic stations yet but remember its inflation target is 2% not Australia’s profligate 3%. It sure weighed on BofAML:
Both the headline and core Consumer Price Index (CPI) came in firmer than expected in May. The CPI increased 0.35% (2.1% over year-ago), and the ex-food and energy core CPI rose 0.26% (2.0% over year-ago), the largest one-month increase for this measure since October 2009. Over the past three months the core CPI is now up 2.8% annualized. By our estimate this implies a 0.16% increase for May in the Fed’s preferred core PCE measure of inflation, which would take the year-ago increase up to 1.5%.
The recent move higher in inflation makes the Fed outlook more interesting. As for tomorrow, the current statement language on inflation is so generic that it doesn’t have to be modified, though the recent news could increase the odds that an amendment could me made to mention inflation moving back towards the Committee’s longer-run objective.
The dots are submitted at the beginning of the two-day meeting, which starts at 10am today, so today’s print shouldn’t have a material impact on the dot plot (recall that the midpoint of the core PCE projection for 4Q14 at the March meeting was 1.5% — which should be achieved in May — we have already been expecting a modest move higher in tomorrow’s projection). At the margin, today’s inflation print further tilts the odds toward an earlier first rate hike relative to our current 4Q15 call….The higher-than-anticipated headline PCE inflation implication (our reading is +0.22%), implies lower real consumption spending growth in May, we think only up 0.1% now. Through the first five months of the year the headline CPI is up at a 2.6% annual rate, even though first half GDP growth may come in around 0.5% annualized….
While some may cheer an earlier Fed rate hike, its hard to see the recent growth-inflation mix as anything other than discouraging.
Advertisement
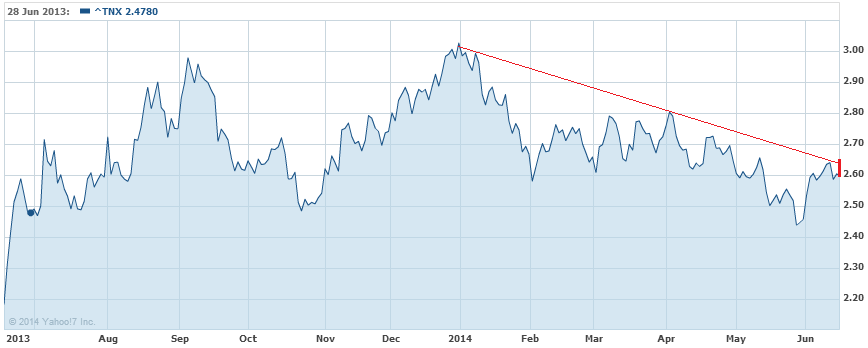
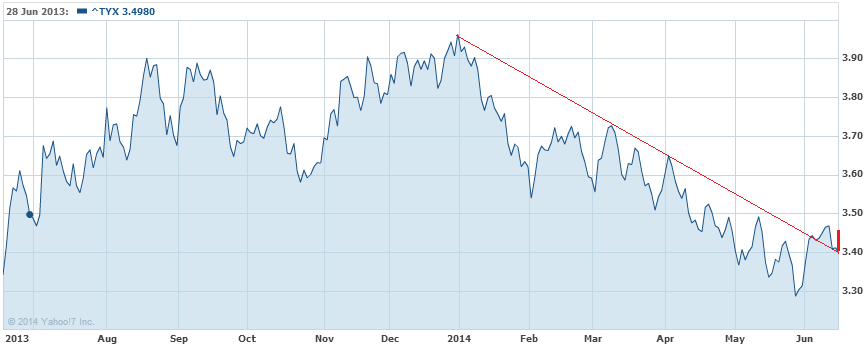
Bonds sold sharply with both the 10 year and 30 year yields threatening to break their recent downtrends:
Advertisement
Not decisive but the momentum in bonds has certainly been arrested for now. And it sure didn’t bother stocks. And here’s why.
Oil is an obvious contributor and will likely persist. So are food prices, which has largely passed as wheat has dramatically retraced its 2014 rally this month, so some relief forthcoming there. I also can’t see the labour market generating much inflation yet, though emerging skills shortages may tilt the playing filed more swiftly than headline figures suggest.
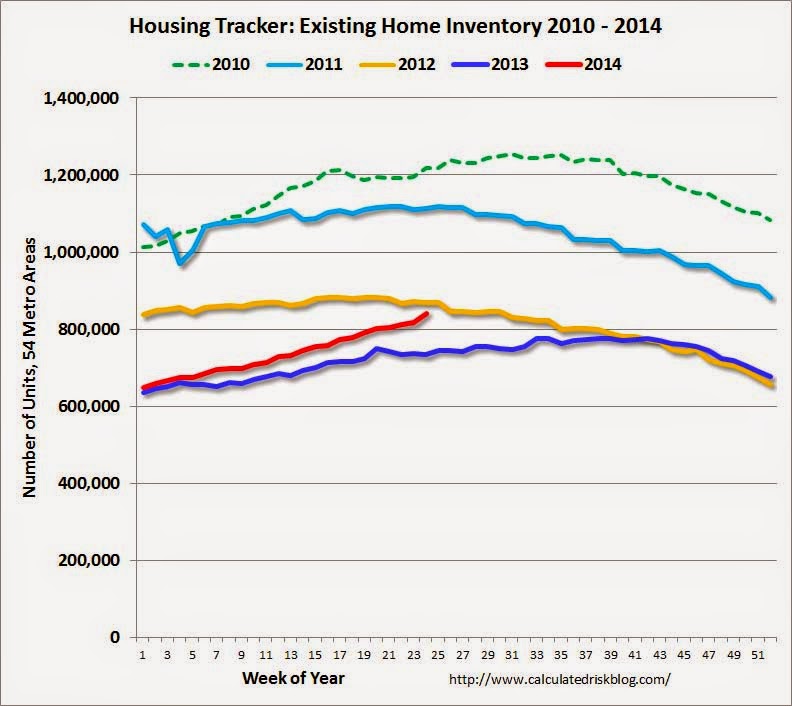
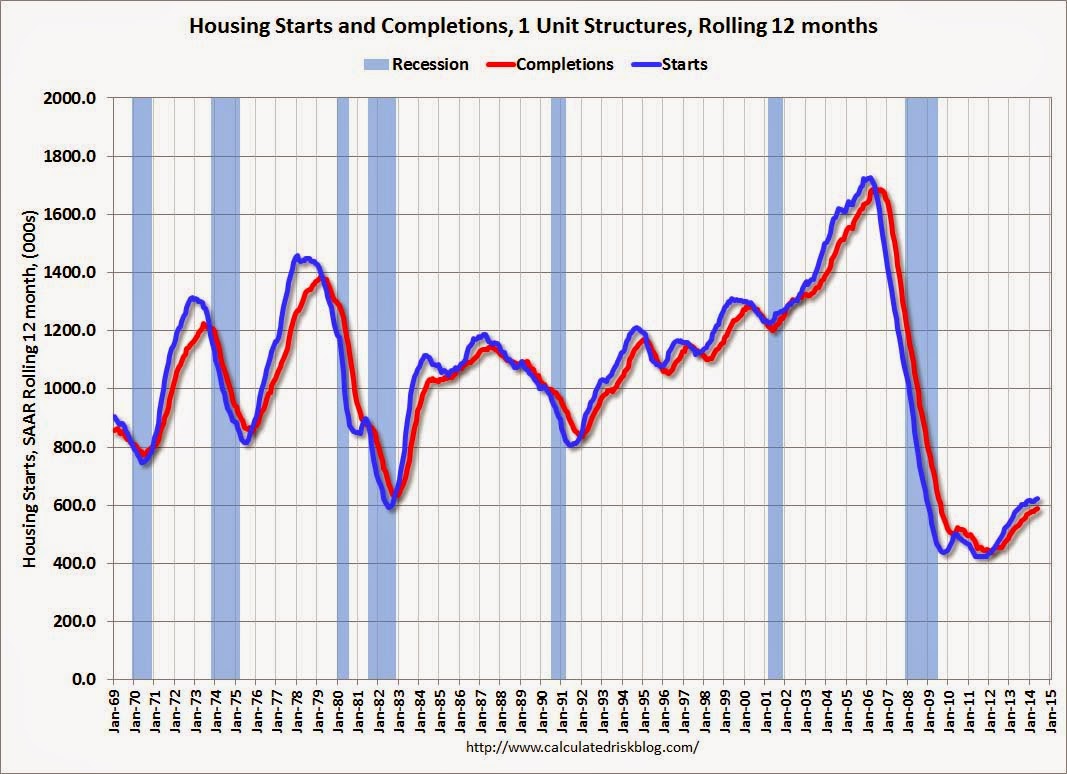
Then there is housing, which disappointed again. Existing house prices are still slowing and will keep doing so as unsold inventory rises:
Privately-owned housing starts in May were at a seasonally adjusted annual rate of 1,001,000. This is 6.5 percent below the revised April estimate of 1,071,000, but is 9.4 percent above the May 2013 rate of 915,000.
Single-family housing starts in May were at a rate of 625,000; this is 5.9 percent below the revised April figure of 664,000.
The May rate for units in buildings with five units or more was 366,000.
Privately-owned housing units authorized by building permits in May were at a seasonally adjusted annual rate of 991,000. This is 6.4 percent below the revised April rate of 1,059,000 and is 1.9 percent below the May 2013 estimate of 1,010,000.
Single-family authorizations in May were at a rate of 619,000; this is 3.7 percent above the revised April figure of 597,000. Authorizations of units in buildings with five units or more were at a rate of 347,000 in May.
Units are better but the combination is still a weak recovery. Hard to see any sustained inflationary pulse here and I can’t see the Fed jumping at shadows. Tapering as she goes.
David Llewellyn-Smith is Chief Strategist at the MB Fund and MB Super. David is the founding publisher and editor of MacroBusiness and was the founding publisher and global economy editor of The Diplomat, the Asia Pacific’s leading geo-politics and economics portal.
He is also a former gold trader and economic commentator at The Sydney Morning Herald, The Age, the ABC and Business Spectator. He is the co-author of The Great Crash of 2008 with Ross Garnaut and was the editor of the second Garnaut Climate Change Review.