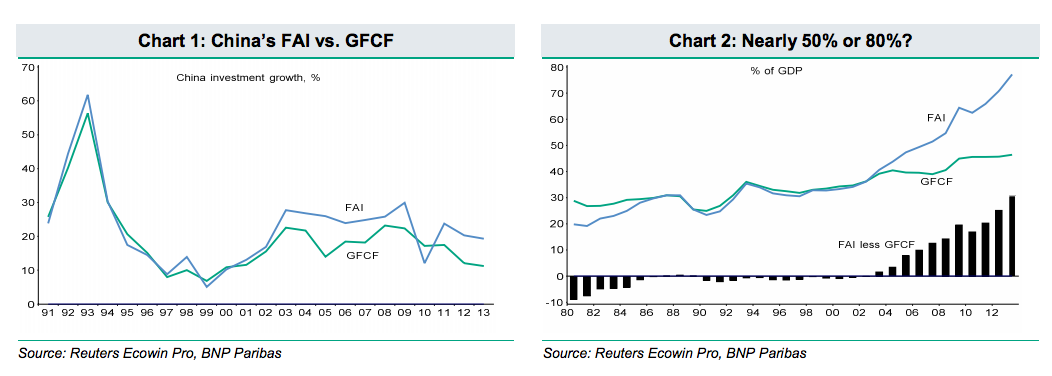
From BNP Paribas via FTAlphaville, comes more on why China’s super high rate of investment is something of a problem. We all know by now the basic issue: that the investment share of GDP has remained high only because it has been forced to by a financially repressed economic model that supports uneconomic construction at the expense of household income. One way of looking at this gap is in the divergence between gross fixed capital formation, which is a measure of value-added productive capital, and fixed asset investment, which is a broader measure of all investment:
The short answer is that FAI is a much broader concept than GFCF. The latter corresponds to the national-accounts concept of gross capital formation, so attempts to capture the acquisition of fixed assets, as well as additions to the value of non-produced assets. FAI, however, adds in spending on existing assets, such as land sales and purchases of used capital, which are excluded from GFCF, as they constitute a transfer of ownership of assets, not the creation of new capital.
The standard, and most obvious, explanation for the ballooning discrepancy between FAI and GFCF is rapid growth in land sales, accompanied by rampant inflation in land prices. Sales of land-use rights are also a key revenue source for local governments’ financing of much of the quasi-fiscal activity that has driven the continued rise in the investment share since 2008. Local government will typically sell land-use rights to property developers and then assign the revenue stream to their own financing vehicles (LGFVs). These revenues are then used as collateral to finance further real-estate or infrastructure projects.
Proving that real-estate transfers and sales of inflated land are the key drivers of the surge in FAI is relatively hard, however. Land purchased by real-estate development firms is typically used as a proxy for total land sales. However, these have been relatively steady, at around 2¼% of GDP. This disguises the fact that land prices have, indeed, soared over the past decade, rising around 4.5-fold between 2004 and 2012, by our estimates. Nominal GDP has seen similar exponential growth, however, ensuring that land-sale revenues have remained relatively constant as a share of GDP. Real-estate investment has certainly shot up relative to GDP, but this has been a factor driving both GFCF and FAI.
FAI’s surge to 30% or so of GDP relative to GFCF, therefore, appears something of a conundrum or, as the IMF has noted, the “cause of of the divergence remains an open question”. Other causes for the escalating discrepancy would be increased spending on other already-owned assets, such as already-purchased residential real estate, used capital goods and mergers and acquisitions. Inflation of the FAI statistics, obviously, offers another partial explanation, although this would assume that the degree of overstatement was continually accelerating. The bottom line would seem to be that China’s frightening GFCF bubble is also being overlaid with an even more frightening bubble based upon the accelerated shuffling around of existing fixed assets at ever faster velocities and ever higher prices.
FAI is going to have to fall back to GFCF as China rebalances and that implies a world of pain for all things commodities.
David Llewellyn-Smith is Chief Strategist at the MB Fund and MB Super. David is the founding publisher and editor of MacroBusiness and was the founding publisher and global economy editor of The Diplomat, the Asia Pacific's leading geo-politics and economics portal.
He is also a former gold trader and economic commentator at The Sydney Morning Herald, The Age, the ABC and Business Spectator. He is the co-author of The Great Crash of 2008 with Ross Garnaut and was the editor of the second Garnaut Climate Change Review.