
Much was made of Wednesday’s break of the 200-day moving average at 5103; however history tells me that it’s far more important that we look at the actual trend of the longer-term average, especially if you’re basing trades around this indicator.
Aligning any trading (or investment strategy) with the prevailing trend is generally the preferred strategy and while money and risk management are key components to any successful trading strategy, trading in-line with the trend can also greatly increases your chances of profitability. The statistics support this concept. Running the quants from the March 2009 lows to today, I found that had you started with $100,000 and sold the index on a close below the 200-day moving average, while exiting the position on a close above this average, resulted in 26 trades. Importantly, the average loss on the trade was $3170, while the average win was $937. This sort of equation is never going to be good, especially when 93% of these trades resulted in a loss. Effectively you would have lost 16.2% of your initial capital. It’s therefore important to understand we were shorting the index when the longer-term trend in the index was up.
Let’s flip it around and look at buying the index during the bull run from the 2009 lows. We will buy the index on a close above the 200-day MA and exit on a close below. In this scenario we would have done 27 trades, of which only 18% were profitable. What’s important though is we made nearly six times the money on our winning trades than our losing trades, resulting in a net gain of 8.1%.
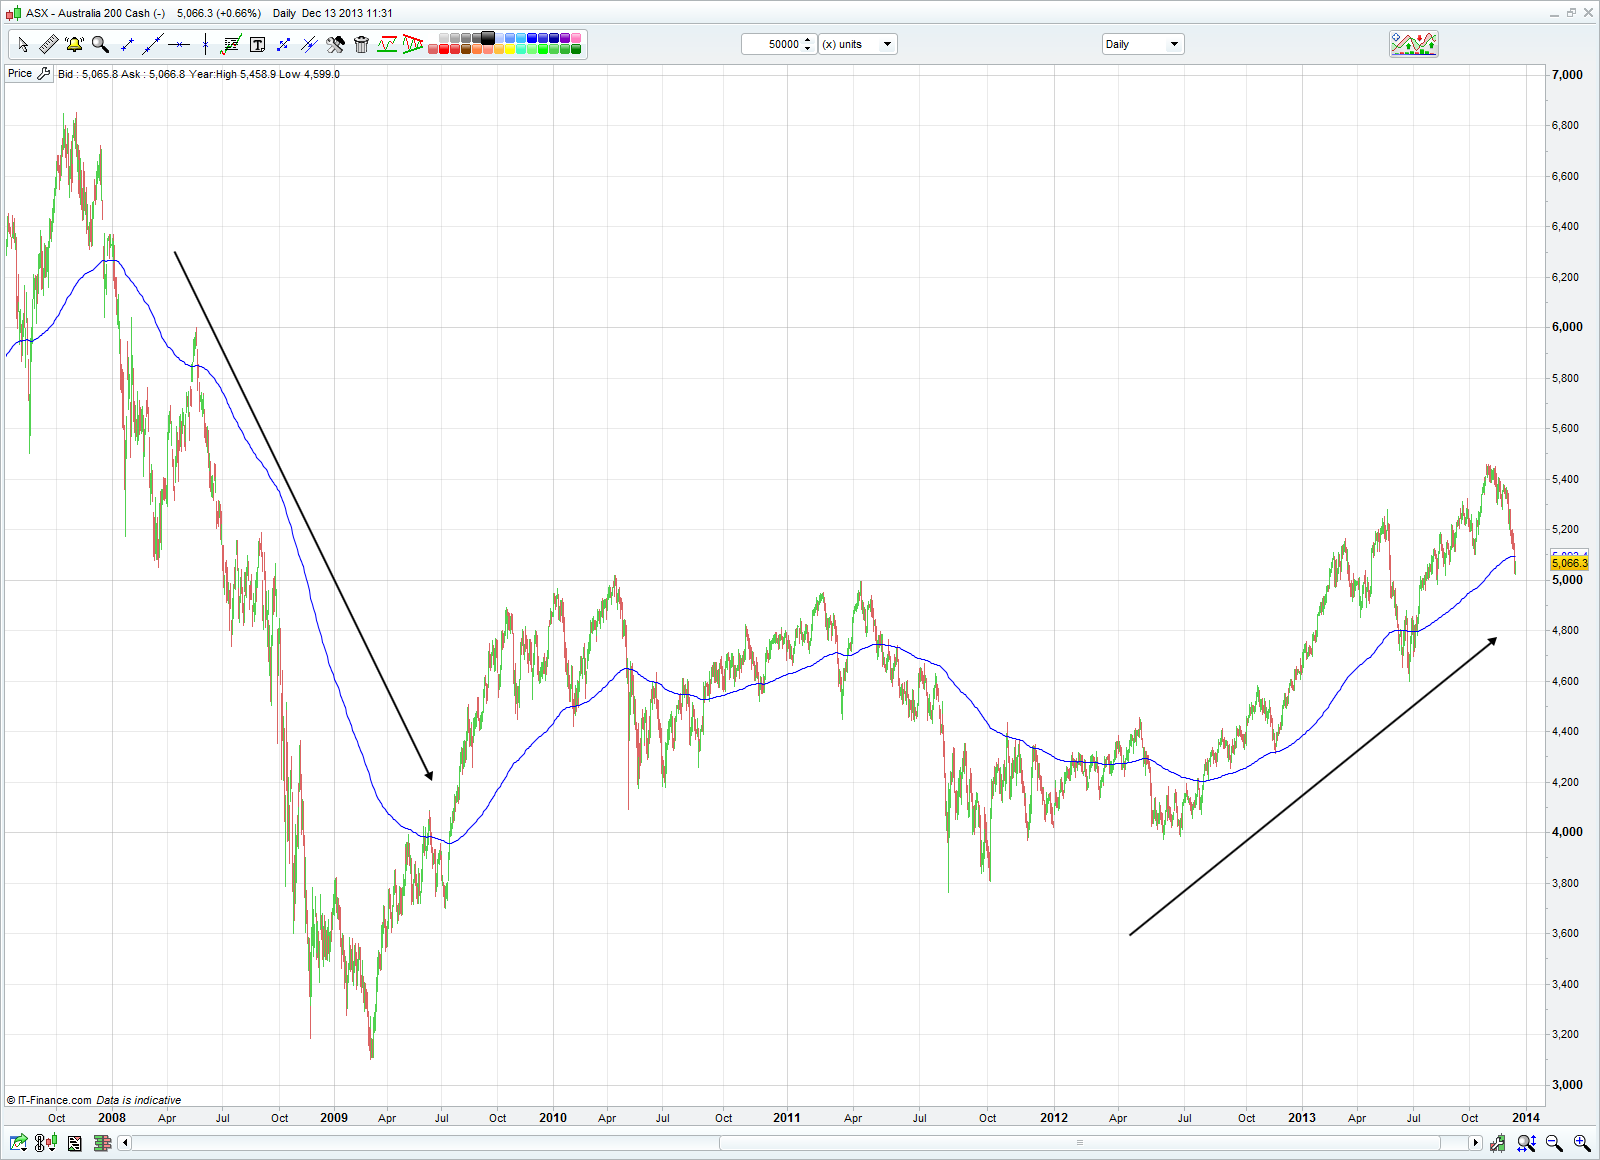
Now let’s go back to 2007-2009, when the ASX lost 54.4% as the GFC took hold. As you can see in the chart below, the prevailing trend in the 200-day moving average was clearly down, and a much better environment for short positions to be taken on the index. In this situation (using exactly the same parameters) there would have been a mere five short trades and while only one of them was profitable, the final return was 27.6%. Because the money made on the winning trade was so much more than the money lost on the losing trades, the end result was a positive one. Still, for those traders looking at a pure win/loss ratio (something that really doesn’t concern me too much) then this strategy hasn’t been that successful.
The index breaking the 200-day moving average is not that important unless the actual trend in the longer-term average is headed lower. The other lesson is that you don’t need to get every trad right; it’s about making sure the money you make on winning trades is significantly higher than losing trades.