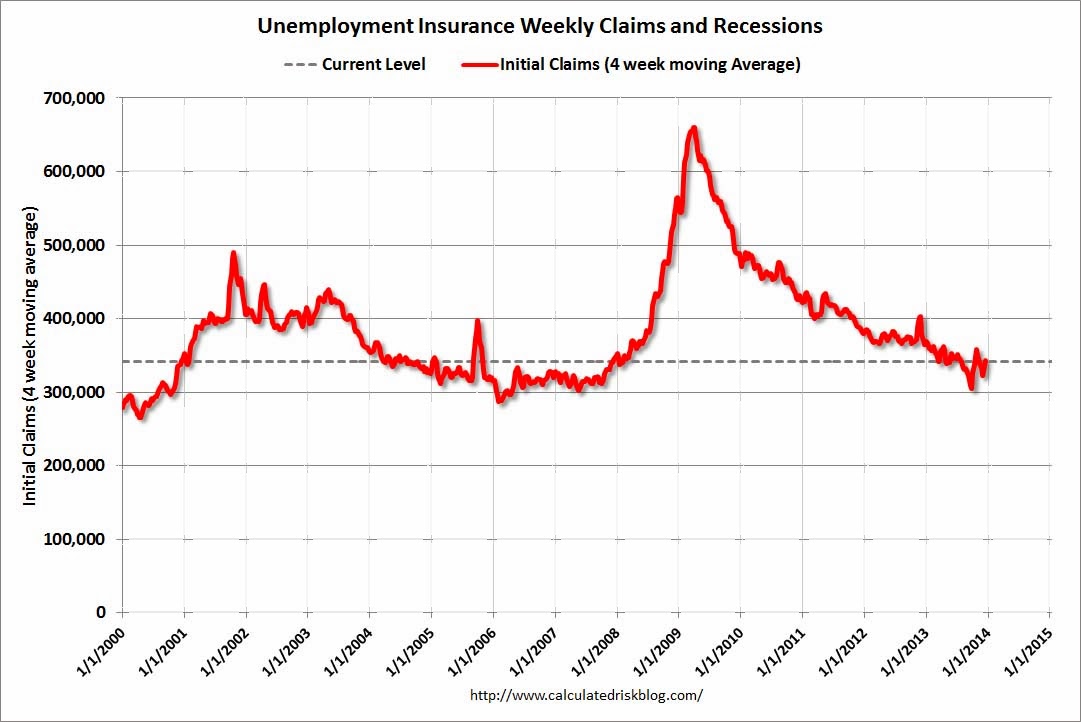
In the week ending December 14, the advance figure for seasonally adjusted initial claims was 379,000, an increase of 10,000 from the previous week’s figure of 369,000. The 4-week moving average was 343,500, an increase of 13,250 from the previous week’s revised average of 330,250.
The four week moving average from Calculated Risk shows a distinct leveling off in improvement:
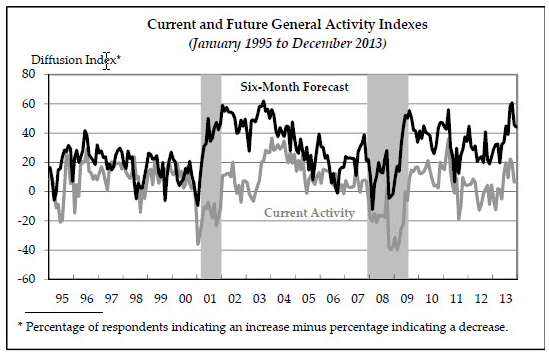
The Philly Fed missed expectations as well at 7 versus 10 but remains at modest recovery levels:
Manufacturing growth in the regioncontinued in December at a pace similar to thatof November, according to firms respondingto this month’s Business Outlook Survey. Thesurvey’s broadest indicators for general activity, new orders, shipments, and employment were positive, signifying growth, andreadings improved slightly in each categoryfrom November. The survey’s indicators offuture activity moderated slightly but continue to suggest general optimism aboutgrowth over the next six months.
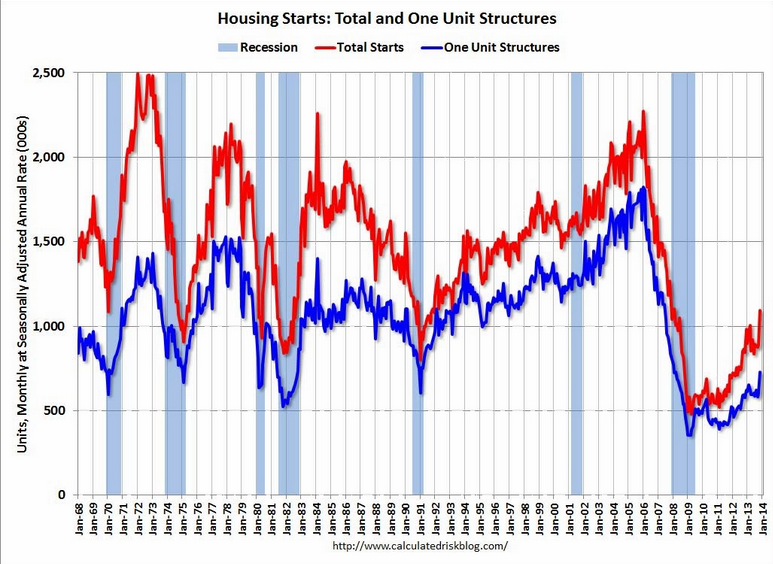
But the talking point has to be housing. Earlier this week we saw a breakout number for housing starts which dramatically snapped a recent losing streak. Also from Calculated Risk:
That is a very big one month jump and I expect it will be revised down somewhat. Still, this is the good news story for the US as building will support growth.
Mortgage applications decreased 5.5 percent from one week earlier, according to data from the Mortgage Bankers Association’s (MBA) Weekly Mortgage Applications Survey for the week ending December 13, 2013.
The Market Composite Index, a measure of mortgage loan application volume, decreased 5.5 percent on a seasonally adjusted basis from one week earlier. On an unadjusted basis, the Index decreased 6 percent compared with the previous week. The Refinance Index decreased 4 percent from the previous week. The seasonally adjusted Purchase Index decreased 6 percent from one week earlier to the lowest level since December 2012. The unadjusted Purchase Index decreased 9 percent compared with the previous week and was 12 percent lower than the same week one year ago.
“Mortgage applications fell further last week, with the market index falling to its lowest level in more than a dozen years,” said Mike Fratantoni, MBA’s Vice President of Research and Economics. “Both purchase and refinance applications fell as interest rates increased going into today’s Federal Open Market Committee meeting.”
That’s worth repeating, “lowest level in more than a dozen years”. Even accounting for some swing away from the major lenders that is not encouraging.
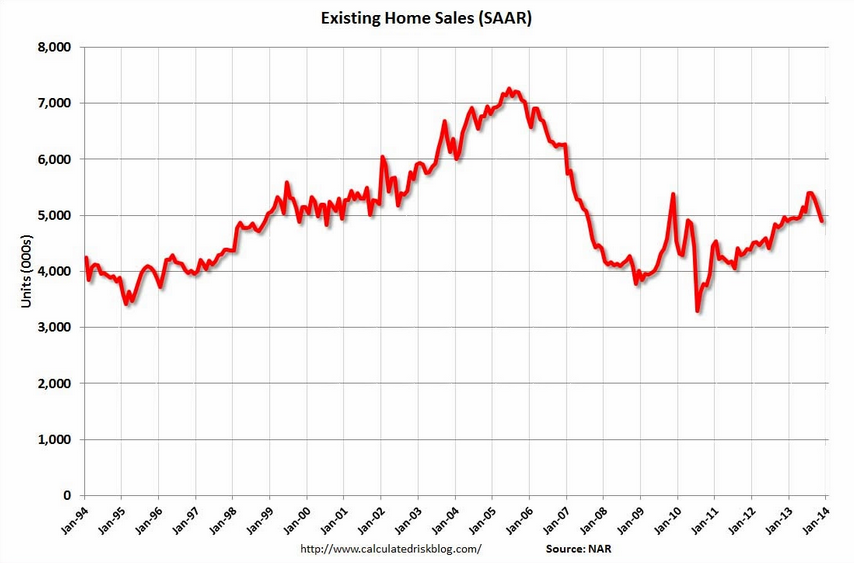
WASHINGTON (December 19, 2013) – Existing-home sales fell in November, although median prices continue to show strong year-over-year growth, according to the National Association of Realtors®.
Total existing-home sales, which are completed transactions that include single-family homes, townhomes, condominiums and co-ops, dropped 4.3 percent to a seasonally adjusted annual rate of 4.90 million in November from 5.12 million in October, and are 1.2 percent below the 4.96 million-unit pace in November 2012. This is the first time in 29 months that sales were below year-ago levels.
Lawrence Yun, NAR chief economist, said the market is being squeezed. “Home sales are hurt by higher mortgage interest rates, constrained inventory and continuing tight credit,” he said. “There is a pent-up demand for both rental and owner-occupied housing as household formation will inevitably burst out, but the bottleneck is in limited housing supply, due to the slow recovery in new home construction. As such, rents are rising at the fastest pace in five years, while annual home prices are rising at the highest rate in eight years.”
The national median existing-home price for all housing types was $196,300 in November, up 9.4 percent from November 2012. Distressed homes – foreclosures and short sales – accounted for 14 percent of November sales, unchanged from October; they were 22 percent in November 2012. A smaller share of distressed sales is contributing to price growth.
Nine percent of November sales were foreclosures, and 5 percent were short sales. Foreclosures sold for an average discount of 17 percent below market value in November, while short sales were discounted 13 percent.
Total housing inventory at the end of November declined 0.9 percent to 2.09 million existing homes available for sale, which represents a 5.1-month supply at the current sales pace, compared with 4.9 months in October. Unsold inventory is 5.0 percent above a year ago, when there was a 4.8-month supply.
The median time on market for all homes was 56 days in November, up from 54 days in October, but well below the 70 days on market in November 2012. Short sales were on the market for a median of 120 days, while foreclosures typically sold in 59 days, and non-distressed homes took 55 days. Thirty-five percent of homes sold in November were on the market for less than a month.
US housing is slowing. I expect that by mid year we’ll be seeing virtually no price growth.
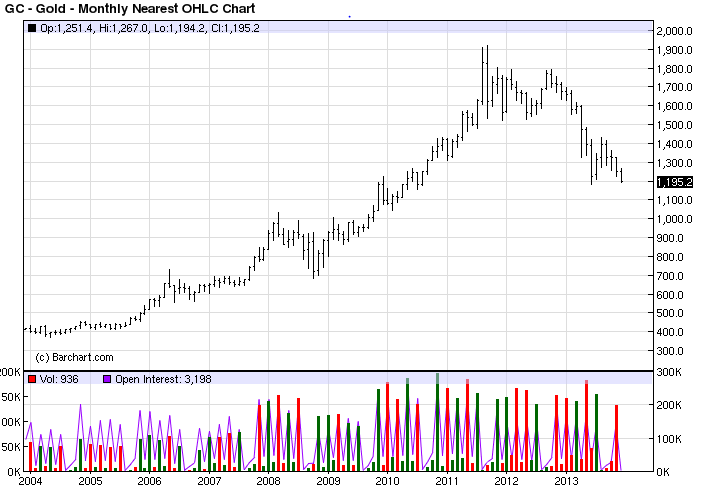
If this data had been out Wednesday, markets would have positioned for no taper. But now they are only focused on the Fed. The US dollar rallied modestly, the long bond remained weak but couldn’t break the 3.91% ceiling, the Aussie held its ground but gold was pounded 3% and looks like it’s going to test and probably break its 2013 low:
Never has following the Fed been so rampant. The beginning of tapering is the first move towards our next crisis. All crises of the past thirty years in this finely tuned global capital markets machine that we live by have begun with monetary tightening. We’ll no doubt march higher of for one or two years but it will come, like clockwork. If gold capitulates, it’ll be very attractive for the next round of trouble.
David Llewellyn-Smith is Chief Strategist at the MB Fund and MB Super. David is the founding publisher and editor of MacroBusiness and was the founding publisher and global economy editor of The Diplomat, the Asia Pacific's leading geo-politics and economics portal.
He is also a former gold trader and economic commentator at The Sydney Morning Herald, The Age, the ABC and Business Spectator. He is the co-author of The Great Crash of 2008 with Ross Garnaut and was the editor of the second Garnaut Climate Change Review.