Advertisement
Find below the latest RPData daily house price chart for Sydney up to the day:
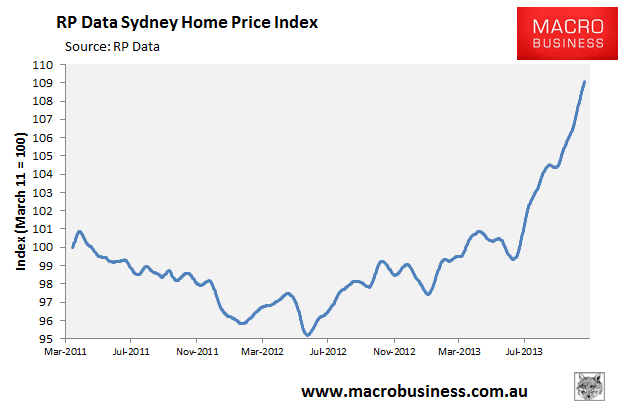
This index is volatile and should not be taken literally. However, in trend terms it is a reliable indicator and there is no mistaking where it is going (unless you work at the RBA). Over four months it has added 10%, an annualised rate of 30%.
If left to run, Australia’s largest city is going to blow up the economy.
Advertisement
About the author

David Llewellyn-Smith is Chief Strategist at the MB Fund and MB Super. David is the founding publisher and editor of MacroBusiness and was the founding publisher and global economy editor of The Diplomat, the Asia Pacific's leading geo-politics and economics portal.
He is also a former gold trader and economic commentator at The Sydney Morning Herald, The Age, the ABC and Business Spectator. He is the co-author of The Great Crash of 2008 with Ross Garnaut and was the editor of the second Garnaut Climate Change Review.