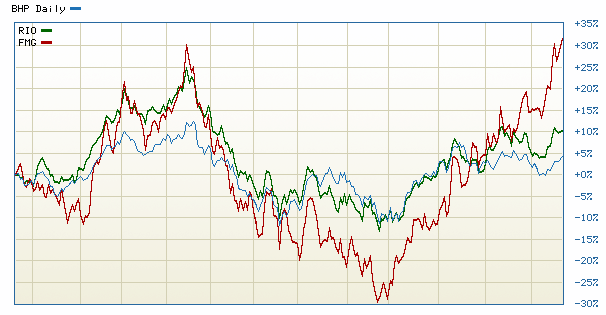
Everyone is euphoric today, of course, with BHP pumping out the dirt and leading the ASX200 to another five year high. BHP itself is up 2.5% and threatening to breakout to a new 2013 high. FMG already did:
And why not? There’s no apparent seasonal dip in iron ore prices. The global recovery looks solid enough and with the taper now a distant memory the pressure has come off global interest rates and emerging markets. It’s the running of the iron ore bulls.
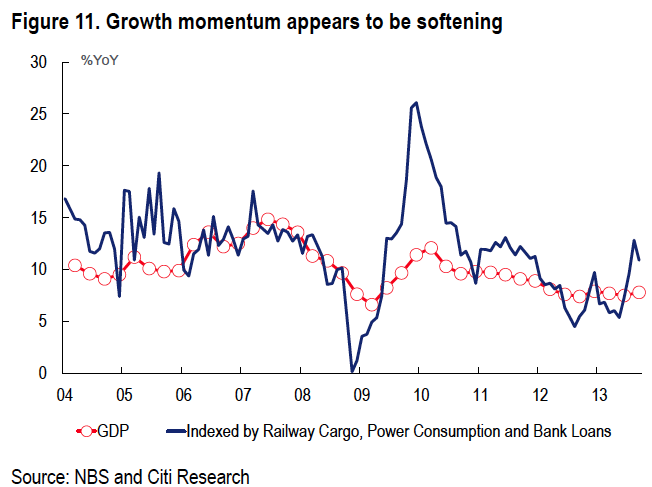
But if I’m right, we are either at or near the peak of the Chinese growth pulse that has underpinned the big steel demand surge that has so far absorbed new iron ore supply. My view has been reinforced by a couple of new notes on Chinese growth. Citi is arguing that Chinese growth has peaked already:
Advertisement
Growth rebounded as expected, but shows signs of softening — China’s GDP grew by 7.8%YoY in 3Q and 7.7%YoY YTD, and the government annual growth target of 7.5% appears within reach. Growth was mainly driven by investment (contributing 4.3ppts to growth YTD, compared with 3.5ppts from consumption), but the service industry continued to outperform (growing 8.4%YoY YTD). However, both IP and FAI slowed on a YoY and MoM basis, suggesting the rebound is losing steam. With inflation rising and job market stable, we expect the government to focus more on reform than on growth for the rest of the year, and credit conditions could become tighter, according to PBOC’s latest press conference. Growth momentum will likely soften under a tighter credit environment and local fiscal constraints, translating to lower YoY GDP growth in 4Q against a high base of last year. We forecast 4Q growth of 7.4%YoY and annual growth of 7.6%.
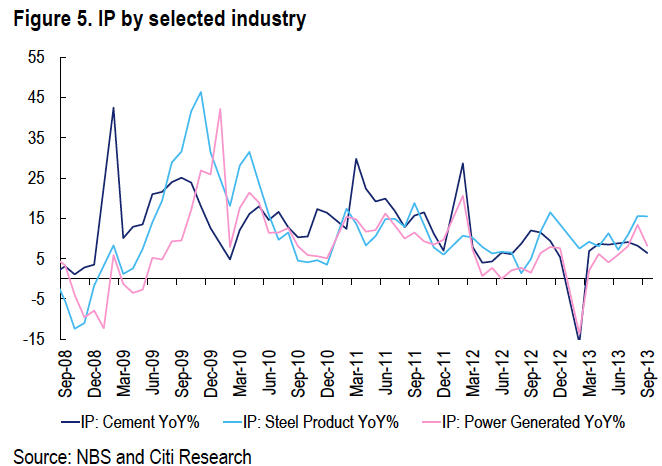
IP growth decelerated to 10.2%YoY in Sep — The NBS seasonally adjusted growth fell from 0.92%MoM in Aug to 0.72%MoM. Specifically, power production slowed from 13.4%YoY in Aug to 8.2%YoY in Sep, steel production slowed from 15.6%YoY to 15.5%YoY, and cement production slowed from 8.2%YoY to 6.4%YoY. Auto production was the bright spot, with value-added accelerated sharply to 17.7%YoY in Sep, supported by robust sales (13.2%YoY). Manufacturing PMI in Sep suggests flattening sequential growth of production, and YoY IP growth may slow further in 4Q partly due to the base effect from 4Q last year.
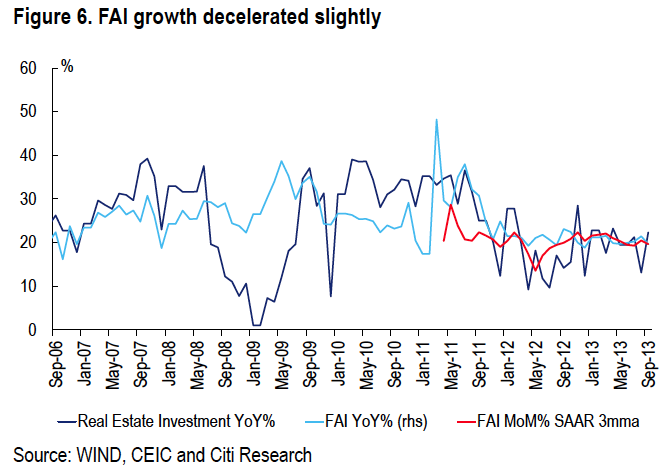
FAI also slowed while property investment stabilized — YTD FAI grew by 20.2%YoY, slightly below 20.3%YoY in the first eight months. The NBS seasonally adjusted growth fell from 1.68%MoM in Aug to 1.28%MoM. Planned investment (YTD) under newly-started projects slowed from 14.4% in Aug to 13.3%YoY. In the first three quarters, infrastructure investment grew by 25.1%YoY, and property development investment expanded by 19.7%YoY. Home starts and land acquisition both improved in Sep, likely to sustain property investment going forward. However, with tighter credit conditions since mid-2013, we expect total FAI growth to slow further to below 20% by year-end.
Consumption weakened but disposable income improved — Nominal retail sales growth fell from 13.4%YoY in Aug to 13.3%YoY in Sep, and real growth decelerated more from 11.6%YoY to 11.2%YoY. The NBS seasonally adjusted growth rose from 1.13%MoM in Aug to 1.24%MoM. Home-related retail sales continued to grow strongly, with sales of home appliances, furniture and construction materials growing by 14.2%YoY, 19.9%YoY and 27.0%YoY, respectively. YoY retail sales growth is likely to be depressed in 4Q due to a very high base last year. Urban household per capita income growth picked up from 6.5%YoY in 1H to 6.8%YoY YTD, and rural per capita income growth also improved from 9.2%YoY in 1H to 9.6%YoY YTD.
I don’t foresee a sudden fall in Chinese growth. But I agree we’re at the peak now with the likelihood that rebalancing will demand further real estate directed tightening in the near future. By Q2 next year China will likely be facing questions about whether or not to stimulate, again. Between now and then the CCCP will map out its rebalancing agenda as well.
The notion that that agenda is not as far away as present conditions suggest has been strengthened by Phat Dragon’s new note today, in which he argues:
Advertisement
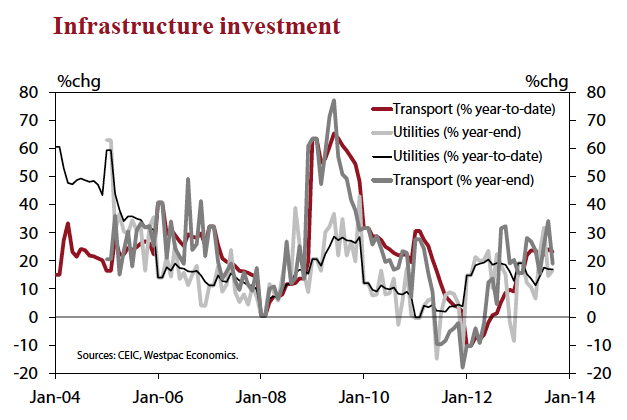
Writing in his Q3 GDP and month-of -September data review last Friday, Phat Dragon argued that “… The major story here it that some fatigue is beginning to creep into the infrastructure spend, particularly in the railway segment. Phat Dragon’s abstract conception of the 2013 growth ‘hump’ has always included an allowance for this, and it is manifesting on cue.” Such a statement demands deeper enquiry, which was unfortunately not possible on Friday. Consider the raw numbers.
Fixed investment in railways ended 2012 at 2.4%ytd and ended the first half of 2013 at 22.2%ytd. As of September, railways capex is tracking at 10.2%ytd. The corresponding year-ended rates are very volatile and the cycle amplitude large, but the month of September figure of –12.8% is certainly striking, given the end-2012 equivalent of +21.3% and the April peak at +61.9%. The predictable cresting and then decline in the growth rate of railway investment is now conclusively underway, and will be a drag on the (progressively broadening) categories of transport, infrastructure and tertiary industry capex through the end of this year and in the first half of 2014.
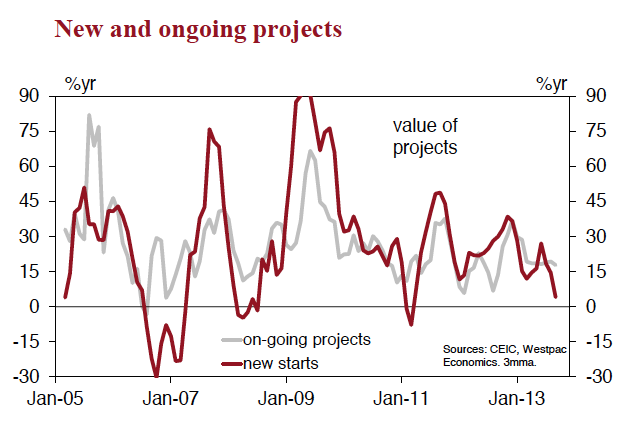
The factors holding up those important categories in the face of the rail slowdown have been accelerating outlays on highways and continued high growth in the strategically important (and massive) utility and environmental management complex. Yet even here there are signs that a peak in growth rates has been reached. Phat Dragon observes that the growth in the value of new projects across the urban economy has slowed quite abruptly, to be well below that of ongoing work, implying that the pipeline is being replenished at a rate that is insufficient to maintain current growth rates. A rolling over in the growth of centrally-approved and SOE capex is consistent with that inference, as is the observation that the investment upturn has been relatively narrow (i.e. very large project size, but fewer of them), which made it fundamentally vulnerable once the swing sectors saw their momentum crest.
As far as I’m concerned the red line on that top chart is ringing the early warning bell on this little Chinese growth cycle.
As we head towards Christmas, markets may happily see the miner’s production ramp up as appropriate to an expansionary China and the perception will probably be supported by the year-end Chinese steel mill restock supporting iron ore prices. But beyond that, the probabilities are swinging back towards a weakening China greeting the great supply wave in Q2 and a big short is brewing.
David Llewellyn-Smith is Chief Strategist at the MB Fund and MB Super. David is the founding publisher and editor of MacroBusiness and was the founding publisher and global economy editor of The Diplomat, the Asia Pacific's leading geo-politics and economics portal.
He is also a former gold trader and economic commentator at The Sydney Morning Herald, The Age, the ABC and Business Spectator. He is the co-author of The Great Crash of 2008 with Ross Garnaut and was the editor of the second Garnaut Climate Change Review.