Cross-posted from Kate Mackenzie at FTAlphaville.
The US shale gas production boom took everyone by surprise — apparently thatincludes George Mitchell himself, who was credited for sparking the shale gas production surge on his death last month.
Yet the variety of output from different shale gas plays is also taking some by surprise. Like Shell, for example, whose Q2 results were grim with a sharp fall in profits and a $2.1bn writedown, mostly of North American shale assets.
John Kemp argues that the misadventures of Shell, BG, BHP Billiton etc are just the sign of joining the shale asset-buying cycle too late, and “(n)ot that the shale revolution set off by new technology is stuttering”. He points out that the British railway mania of the 1840s, while losing plenty of money for some investors, left the country with useful infrastructure for many, many decades.
This is a good argument, but one that has significant drawbacks. Of course it’s a problem if creditors or shareholders are too short-sighted for investments in truly revolutionary assets, especially in the realm of energy, where change always entails challenges with the built environment, path dependency, policy and more. That’s partly because it’s difficult to apply evenly.
The cratering of the US natgas price is good in that it means supply is abundant, something which has great societal value, if not seen that way by markets and investors. And perhaps the abundance can be counted on for many years to come – another good thing, arguably. The problem is where and how this argument is applied. If one is going to look decades into the future, for example, and consider the public good rather than at just a few years of investment returns, the shale gas boom may not be a good thing at all.
Moving away from these thorny questions and back to supply and pricing — how reliable is the production outlook, anyway?
The picture is confusing. As the FT’s Greg Meyer reports:
Supply from Marcellus states such as Pennsylvania and West Virginia has been climbing even as production from other shale fields has levelled off. Gross production is up 45 per cent so far this year from the same period in 2012, according to Bentek Energy. In the Haynesville shale straddling Louisiana and Texas, production is down 21 per cent year on year.
So there’s resilient output from Marcellus which is currently more than offsettingdeclines in other plays. As Greg points out, this abundant supply means gas is trading for as little as $1 per mBTU in Pennsylvania – less than a third of the Henry Hub benchmark.
That, too, is taking many by surprise, as Barclays’ Biliana Pehlivanova and Shiyang Wang wrote last week, while upgrading their forecasts for Marcellus output:
Pipeline flow reports suggest that output from the Marcellus has risen 2.1 Bcf/d in the first six months of this year, compared with a 1.5 Bcf/d gain in the first six months of 2012 – a 40% acceleration. Earlier this year, we had projected that the play will match last year’s rate of growth (Gas and Power Kaleidoscope: Marcellus: Promised land, March 5, 2013). Many market participants we speak with had anticipated even slower increases, limited by a slower pace of infrastructure additions and a moderation of drilling.
The Marcellus story seems to be that both the resources are better than expected, and drilling itself is improving, because increase in Marcellus output is happening despite a downturn in overall drilling activity. Yet this hasn’t translated to the other shale gas plays.
It also underlines how fickle shale resources are — one play is not going to be like another. Projections are difficult. And energy forecasts are difficult enough as it is, even without geological variations.
Both the surprises over increased production and the fickleness can be seen in US shale oil.
A June note by Barclays’ Kevin Norrish points out that most oil forecasters, including Barclays’, have raised their forecasts of US oil production numerous times in the past 18 months.
EIA forecasts of US oil liquids production have raced to keep up with actual output:
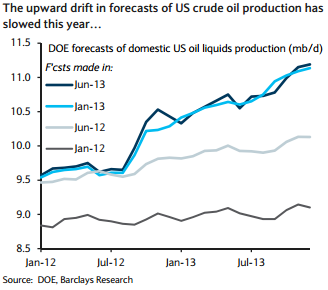
And yet, they were still falling well short of accurately gauging the rate of growth:
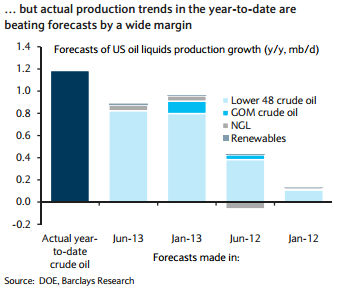
Although the rate of drilling has slowed in shale plays such as the Bakken and Eagle Ford this year, output is still going up due to ongoing and rapid productivity improvements. Moreover in the Permian, where development started relatively late, drilling is still rising rapidly and increases here are likely to be the big driver of US oil production growth over the next few years.
Meanwhile, Norrish writes, the discount on wellhead prices for Bakken oil shale producers relative to WTI have fallen to a mere $3/barrel, so the incentives to keep drilling for shale oil are there.
There are still plenty of pundits arguing that surging shale gas output isn’t being taken seriously enough — or at least, there were until quite recently. Expectations change slowly. Yet this can also mean that they eventually overshoot, which was part of the mistake with the companies who overpaid for shale assets (the other mistake being overly optimistic on the gas price).
Unlike the shorter-term forecasts, Norrish says Barclays is unlikely to raise its 2020 outlook:
However, it is perhaps wise to exercise a degree of caution over longer-term shale oil forecasts and for now we are sticking with our 2020 projections which imply a sharp slowdown in tight oil production compared with current levels. This is partly because of the steepness of decline rates for shale oil wells. For example, after two years a typical well in the Bakken-Three Forks drilled in 2012 is likely to be producing at less than 30% of its initial production rate. It also reflects the likelihood that many of the best plays for crude oil extraction are being developed early (recent disappointing performance relative to expectations at the newer Utica shale play in the north-east US and Canada backs this up) and that a lot of the very big productivity gains (shortened well drilling times, increased initial production rates and better rig efficiency) have already been made.
Their forecasts to 2020 are only for an additional 3.1m b/d in total US liquids to come online by 2020, which is the same as the EIA’s forecast and significantly less than the IEA’s (3.8m by 2018) and much less than a widely-reported paper from the Belfer Centre at Harvard’s JFK school of government (5.4m by 2020).
It all comes back to the fact that energy forecasts are very difficult (both production and consumption), and the further out you go, the more ridiculous the endeavour becomes.
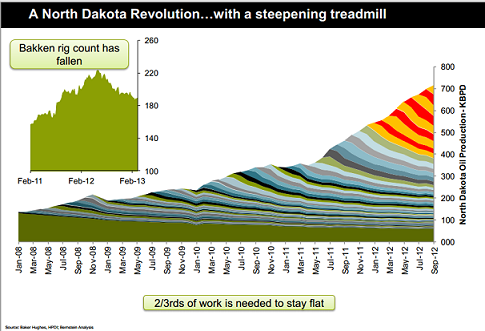
Here’s a very detailed look at the output from US shale oil assets to date from Bernstein Research’s energy analysts Bob Brackett and Scott Gruber. Brackett told clients on a conference call in June:
Contrary to the shale gas revolution, where newer plays yielded better economics over significant acreage, emerging oil plays have not matched the productivity of the Eagle Ford and the Bakken. Meanwhile, peak rates of new wells drilled in the Bakken have declined since 2010, while peak rates in the Eagle Ford have been flat.
In the chart below, the yellow and red lines show all new drilling since January 2012. If no new wells were drilled, a steep decline rate would have been evident:
Texas meanwhile is reliant on the Eagle Ford:
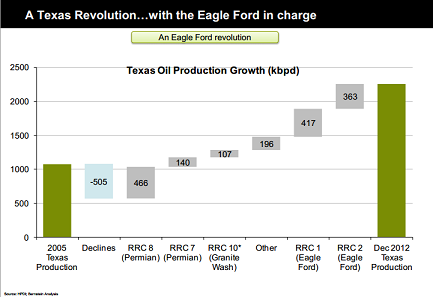
The third placed play, the Permian Basin, is well below the productivity of Eagle Ford and Bakken, particularly when the number of wells drilled are compared to output.
The argument is complicated and detailed, but here’s their view of the cost curve:
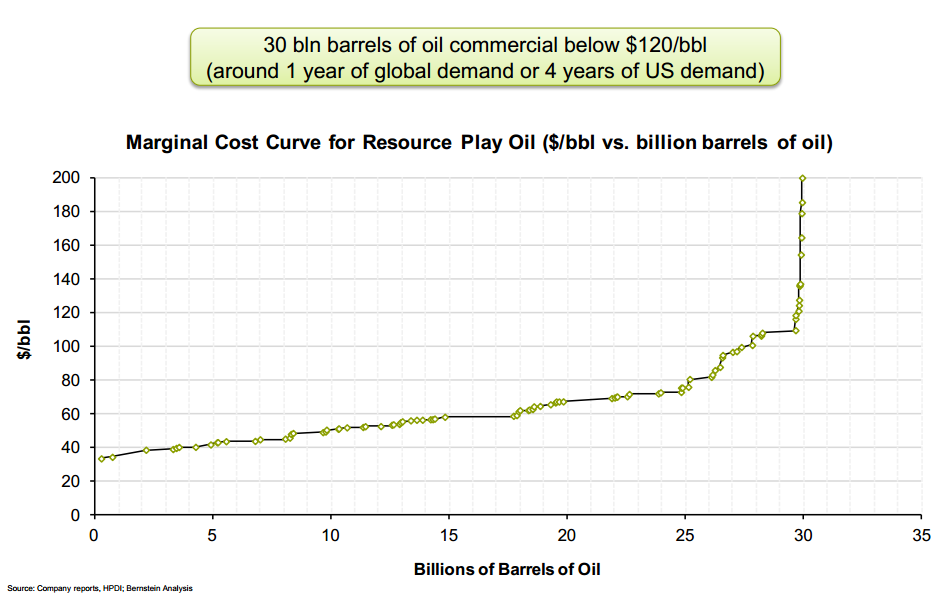
In short, there just isn’t anywhere near enough to provide much ongoing “energy independence” for the US, at least not at below $120 per barrel. On Bernstein’s cost curve, marginal production costs beyond that rises far too sharply to be realistic.
But what about the advances that are leading to lower production costs? Brackett and Gruber argue that drilling costs themselves are falling mostly because of a cyclical downturn in service costs, with only a fraction of the fall in costs coming from secular improvements in technology and so on. Here is Gruber:
The largest cost component of a shale well is pressure pumping, or hydraulic fracturing, which comprises 35-40% of the cost. Pumping rates are now down about 30% from the peak in 2011 due to oversupply. Combined with deflation across other key inputs, the cost of a shale well has dropped about 15% over the last two years, just from cyclical factors. We also estimate that secular efficiency improvements have cut costs by another 4% over this period. Thus the cyclical factors were almost four times more impactful.
Furthermore, they say oil investors are missing the fact that resources vary within each basin, not just between basins. As the good resources are drilled first, their yields fall rapidly — and then drilling shifting inevitably shifts towards the lower-yielding sites.
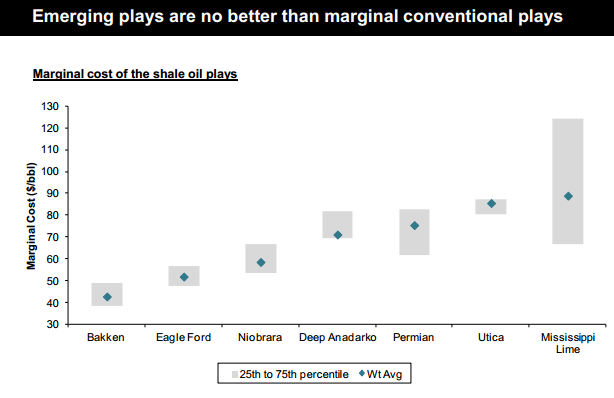
The end result is that the cost of a marginal barrel of US shale oil remains high — in fact at a comparable level to “conventional” plays:
The cost curves are based after two years of monitoring emerging shale plays. Brackett says that has also led them to see a low probability of any new shale plays being incredibly abundant:
So we’ve spent a lot of time in the last two years scouring for the next Eagle Ford, for the next Bakken in hopefully a fairly meticulous and methodical way. We would love to be able to discover one in its infancy and come out and pound the table about how wonderful a new shale could be – to date we’ve been disappointed by the emerging shales we’ve encountered.
Consequently, they have oil price forecasts above consensus, with “WTI near $100s/bbl near term, $120+/bbl after 2017″.
