
It would be easy to think that Australian interest rate markets and the aggressive RBA cuts that are priced into the curve are just a reflection of some sort of prospective European meltdown. As it stands there is around 150 bps of rate cuts priced into the cash curve and with 3 year swaps sitting around 4.10%, rates are priced to stay low for a while.
But has the market taken rates too low too soon and has the pricing gone too far?
It’s a question that isn’t as easy to answer as we may think and one where we need to first look at the economics of the Australian economy then we need to address market pricing and have a look at history.
MB readers know that the economy has been slowing for some months and I’d argue that there is much more than just an offshore catastrophe being priced into interest rate markets.
The recent seasonal adjustments to the CPI and the reduction in the level of underlying inflation blunts the force of the RBA’s recent argument about inflationary pressures. But, absent an offshore catalysing event, that alone won’t make them cut rates.
Rather I think that household retrenchment and saving will lower economic activity in the economy and that the RBA has overplayed the extent that the mining boom induced income will wash through the Australian economy.
Increasingly, we are getting confirmation of this theory. Unfortunately, we are seeing Australians lose jobs at an increasing rate. Data released yesterday by Westpac on consumer unemployment expectations suggests this is going to get worse.
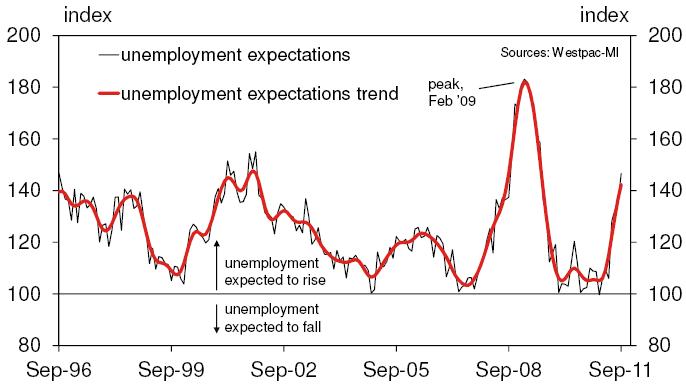
There is a really good correlation between an uptick in unemployment expectations and a reduction in spending which feedbacks into weaker economic outcomes. After all, at its base level, the RBA hikes rates to slow spending, dampen activity and effectively make people worried about or actually lose their jobs thus reducing activity in the economy and reducing inflationary pressures through slowing growth.
So you won’t be surprised by the next chart.
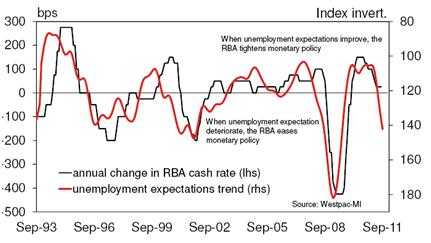
Like the NAB business survey employment sub-component the two charts above suggest the employment picture is deteriorating and will do so materially.
Obviously an economy is not just employment but the RBA has made it plain that the Phillips Curve is very influential in its medium term forecasts for inflation – embodied in a paper one year ago examining the inflation/unemployment trade off and showing inflation accelerates in Australia when unemployment heads below 5% – so we can say that the pressure to raise interest rates is, for all intents and purposes, gone.
So, has the market factored too much pessimism into current market rates? Should borrowers be locking in the rates on offer or could they go even further. When it comes to markets it’s always worth looking at the past relationships to see what it can tell you about the future.
This morning the swap rate sits at around 4.16%, roughly 67 basis points below cash (up from when we wrote this last night however).
If you look at the graph below, we have plotted (in red) the spread between the 3 year swap rate and cash (LHS axis). The very thin purple lines (LHS axis) represents the basis point movement of the official cash rate and obviously the blue line is the RBA cash rate (RHS axis):
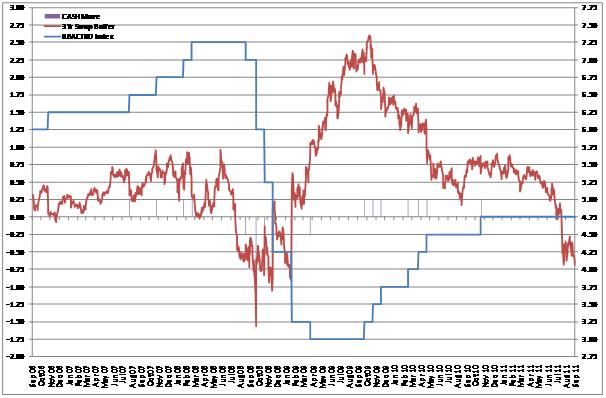
We are currently seeing a negative spread the size of which we saw prior to the 2008 decreases. The only real instance of the spread exceeding the current one was prior to the first 100bp decrease after the failure of Lehman Bros. But on average, even after that big drop, it appears to average -75 points until the cash rate reaches the low from the previous easing cycle of 4.25.
Subsequently markets re-appraised the trajectory for rates and the spread again moved to -75 before the next 100 bp drop to 3.25.
So what to make of this?
As the chart below shows swap markets always overshoot. The black line is the swap rate, purple line 90 Day BBSW and the blue line the actual RBA Cash Target rate.
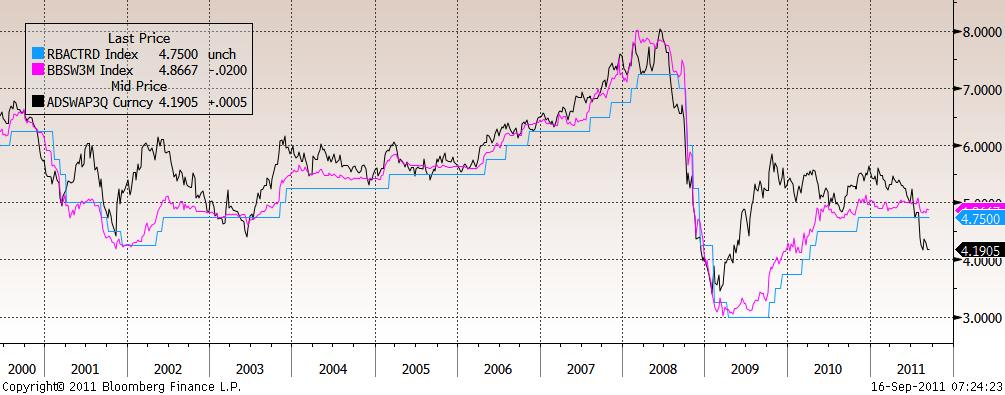
Just as the market build in too much expectation of rate hikes, and too soon, in the RBA’s retreat from 3% in 2009 and 2010 so it could be too early now. Certainly the RBA has been reinforcing they don’t want to cut rates recently in speeches from Governor Stevens and deputy Governor Battelino. So the current spread could be an overshoot to the down side if that remains the case.
But the employment picture suggests that rates may need to go down to 4.25% in 2012 (even without the European catastrophe) so a drop in the 3 year swap rate to 3.75% is a distinct possibility. But history suggests that this does not does not necessarily mean it will be the bottom of the cycle.
The historical low of the Australian cash rate occurred in 2009 at 3%, 1.75% below where we are now. If it is that the cash rate, for whatever reason, is reduced 100 basis points to 3.75% and whatever caused the drop, be it domestic economic weakness or offshore developments, looks to continue, the 3 year swap could well go to the 2009 low of 3.30%.
That would be an overshoot and we doubt it would break beyond that, it may struggle to break the past low of 3.42%, but then again, history guides, it does not predict.