
In an ideal world, a selection of price indexes would be easily constructed and highly reflective of economic reality. But we don’t live in that world, and we muddle our way through doing our best to measure price changes in the broadest sense.
Despite many unresolved issues surrounding the methods and interpretation of hedonic price indexes, they are becoming more widespread due to decreasing costs of data collection. For instance, a hedonic price index for personal computers was introduced into the ABS Producer Price Indexes in 2003 and into the Consumer Price Index (CPI) and the National Accounts (to create the price deflator for household final consumption expenditure) in 2005. Prior to this time the ABS simply used the US hedonic computing price index and with an exchange rate adjustment (here). The ABS also adjusts for quality change in other price index data in the CPI, and plans to release more information about those adjustments following the 16th review of the CPI.
Property research firm Rismark utilises the housing sales and information database compiled by RPdata to publish hedonic home price indexes.
Today I want to discuss one unresolved issue surrounding the interpretation of hedonic price indexes – the lower bound problem. Put simply, the lower bound problem says that quality improvements do not imply that prices faced by consumers have dropped, especially if lower quality goods are no longer available.
Let us use the example market in the table below to demonstrate the lower bound problem, and see how different price indexes can produce significantly different results. This hypothetical market could be computers, cars (add a zero to the prices), homes or any other market where the quality of the good changes noticeably over time.
In the table, animal names are the models. For car markets they could be Corolla, Landcruiser and so on, or for computers, Dell Latitude, Apple MacBook etc. The reason to include models is that one method for determining price changes is called the model matching technique. Because models typically have fewer quality changes than the market as a whole, and that they typically represent a segment of the market (budget / premium), compiling prices over time for the same model can give a reasonable measure of price changes for similar quality products. In the table above two models are highlighted, Kangaroo and Echidna, to show how their prices have changed over the period.
The number beside each model is a measure of quality. I have used a single number in this situation, but typically there would be a number of associated quality measures. You will note that the quality of each model improves over time.
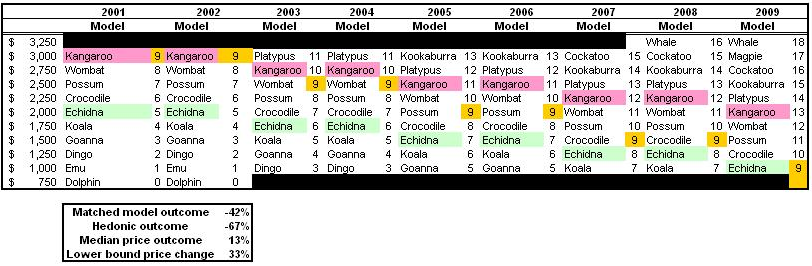
With this data we can compile four different price indexes – hedonic, matched model, median and lower bound.
The hedonic (quality controlled) method for measuring price change will show the largest price decline. If we were to buy a ‘quality level 9’ product in 2001 it would be $3,000, while in 2009 it would be $1,000. A 67% decline in price.
Using the matched-model method gives a more conservative price measure. In the table two models are highlighted, Kangaroo and Echidna, to show how their prices changed over the period. If we take the average price change of the models we can match over the period we get a price change of the hypothetical good in this market of -42% over the eight year period.
Using a median price index, where quality is not considered, the data in this table shows a median price increase of 13% over the period (assuming an equal volume of sales at each price level). In this hypothetical scenario, the median measure more accurately shows the movement in the price of the market as a whole. If you wanted to stay at the same level in the market, this is the price change you would experience.
Finally, we can estimate the price change for the lower bound market entrant at 33%. The cheapest computer/car/shoe/phone/appliance, or whatever good this happens to be, has gone up in price significantly while the quality adjusted measures show large declines.
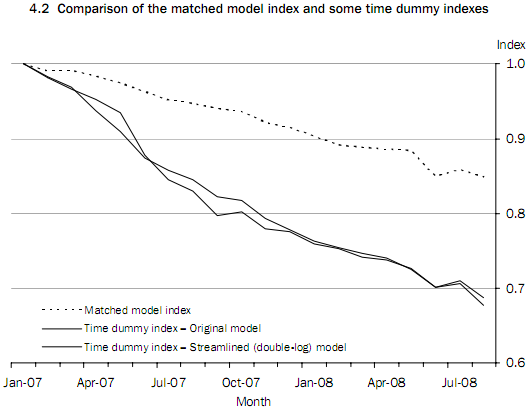
While this hypothetical market might appear exaggerated, it provides very similar results to the ABS price index for computing and audio-visual equipment. The following graph shows that computers with the same hardware specifications declined in price by 30% from January 2007 to July 2008. The same models only dropped in price 15% (using the matched-model method). So the question is: do we include the extra 15% decline in our price index?
Computing and audio-visual equipment is just 1.53% of the basket weight in the current 15th CPI series. So is we use the conceptually more sound matched-model method instead of the hedonic method for just this one tiny component of the consumption basket, we can calculate that the whole CPI itself would be 0.43% higher since Sept 2005 (the computing index itself declined 56% over this period). Given the size of this impact from an apparently insignificant item, it does raise important questions about the impact of quality adjustments in heavily weighted CPI components such as housing (19.53%) and transport (13.11%). And in particular, what the CPI might have been in previous decades had similar adjustment been made.
The same lower bound problem also applies to home price indexes. When interpreting such price indexes it needs to be understood that when there are broad quality changes in the market for that good, a hedonic price index will be lower than a median price index, and much lower than a lower bound, or entry-level, price index.
This lower bound problem does not mean that all hedonic price indexes are bad. In fact, they are extremely valuable the property market, where hedonic price analysis have a long history in valuation. But a proper understanding of the method, and its imperfections, is necessary for informed interpretation. Of course, for all price indexes this is the case.
While my preferred price index for housing is hedonic, for less durable consumption items in the household budget I personally consider the matched model technique a maximum allowable quality adjustment. I also believe that there should be a focus of changes in prices near the lower bound for consideration of welfare payments and income incrementation that is based on a price index.
I will finish with a short quote to wrap up the discussion. In his informed submission to the 16th CPI series review, Rob Bray requests that the ABS:
Revise the approach to quality adjustment to take account of the actual utility consumers achieve from changes in product ‘quality’; and also consider an approach which reflects the extent to which products actually exist in the market place for consumers to purchase
I couldn’t agree more.