
The Consumer Price Index (CPI) forms a backbone for economic analysis. We apply it to a broad range of circumstances to modify nominal dollar values into comparable real dollar terms, and our central bank has relied heavily upon it since mid-1993 when it found practical expression for its statutory objectives for monetary policy in the form of a 2-3% inflation target.
But the real truth of the matter is that the CPI we all know and love is a chameleon. The CPI from the 1970s is not the same economic indicator as the CPI from the 1990s and is very different to the CPI of the 2000s. Over periods of greater that five years (give or take) the CPI loses its usefulness almost completely. This should be taken as a word of caution when examining long term real dollar trends in any economic data.
With this in mind it is useful to explore the exact nature of the changes to the index over time as a starting point for any further analysis.
Below is a graph of the annual CPI change since 1949 (the ABS began compiling a CPI series in 1948 so the first full year data is from 1949). On the graph I have marked when the ABS has changed the methodology for compiling the index.
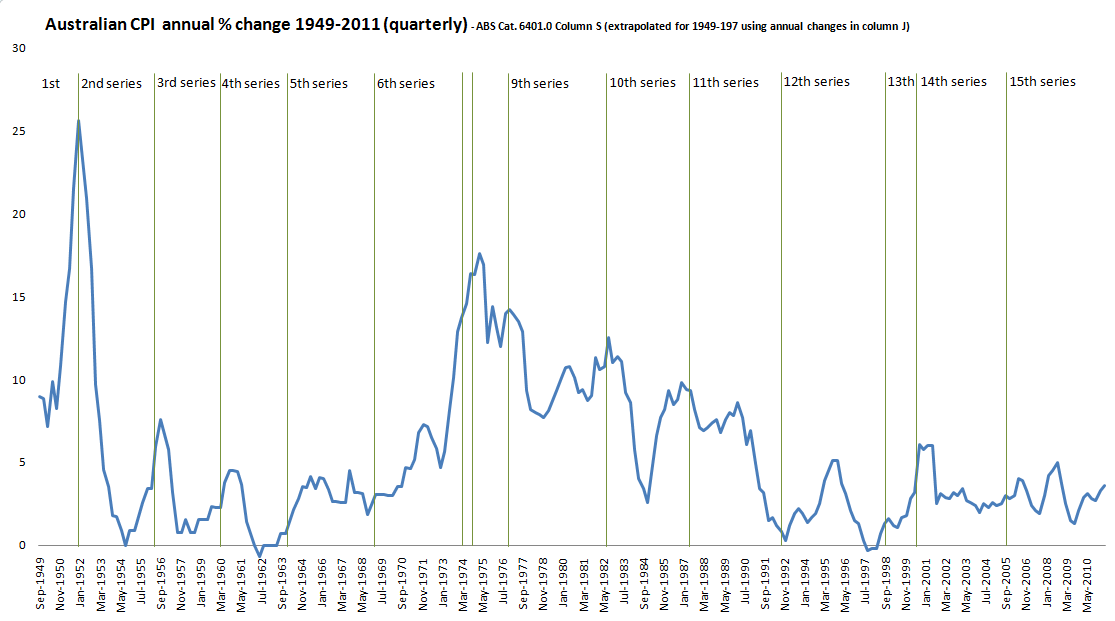
In its original incarnation, the CPI was used to estimate changes in the cost of living and often used to inform wage and salary negotiations. As an index it was relatively unsophisticated. For the curious economic historian, the original 1948 components of the index and weights are shown in the table below.
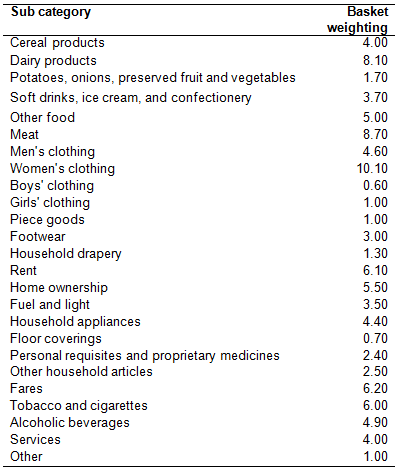
One thing that strikes me is the 15.7% weighting to clothing and footwear, which is only 3.9% in the current 15th series.
The first few revisions of the CPI where many centred around improving the specification of the basket of goods. The 2nd series introduced a weight to expenditure on ‘motoring’ while the 5th series introduced furniture, frozen vegetables and newspapers and magazines into the basket on the basis of the 1961-62 census of retail establishments.
Bigger changes were to come. The 7th series refined the basket weightings even further based on the 1971 census, the census of retail establishments and the new survey of motor vehicle usage. The 9th series reweighted the basket following the 1974-75 Household Expenditure Survey (HES) and using that data refined the group to which the CPI as a cost of living index was relevant – capital city employee households in the lower 90% of incomes. This factor is important, as one would expect that the exclusion of very high income households would keep the basket of goods weighted towards basic living expenses.
In the 11th series the home ownership subgroup was modified by deleting the expenditure class house purchase including alterations, and replacing it with mortgage interest charges. No doubt this was to reflect the nature of housing as a durable good, with interest as a proxy for the annual portion of consumption of the home.
In the 1992 12th series revision the index was rebased to 100.
The changes in the 13th series in 1998 are probably the most significant single change. As the ABS explains-
The most noticeable changes to the item coverage were the exclusion of mortgage interest and consumer credit charges from the index and the inclusion of expenditure on new dwellings (excluding land).
This is a reversion back to the previous method of measuring the price of owner-occupied housing, which instead of estimating the annual cost of the service a home provides, it calculated the purchase cost as a once off payment, with weighting reflecting the infrequency of the purchase. What it means in practice is that only the cost of new dwellings excluding land make it into the index (which makes it a residential construction cost index).
This change in the treatment of housing was strongly supported by the RBA, as they argued that while dwellings themselves are consumption items, the land upon which they rest is an investment (it doesn’t get ‘used up’ over time) and should be excluded from the index.
But surely the most significant change in the 13th series was that the purpose of the CPI changed from being a cost of living index primarily designed for income adjustment purposes, to a measure of inflation faced by consumers to support macroeconomic policy decision making.
The great irony here is that inflation targeting as a monetary policy tool had only been operating since 1993, and was probably conceived upon cost-of-living notions of the CPI. Yet five years later the measure of the inflation being targeted drastically changed, and yet the policy remained the same.
To compensate for this change the ABS introduced its Analytical Cost of Living Indexes (ACLIs) to fill some of the information void left by the new CPI. However, they left out house purchase or mortgage interest from all these indexes. Luckily, since 2003 a mortgage cost index has been compiled (Table 8). If we use the 7% weighting of mortgage interest from the 12th series method we can see that the CPI would have been 0.8% higher on average since 2003 (noting that the housing boom from then covered only half the country, although with some reconciliation with the house price index this 1998-2003 gap could be filled – a future project perhaps).
In the 14th series revision, the weightings were again changed to address possible consumer substitution between commodities in response to relative price. This was to overcome the problem of substitution bias, which arguably results in an overestimate of the CPI. The following quote from John Williams tells us both what substitution bias is, and the shortcomings of adjusting a price index to compensate.
The Boskin/Greenspan argument [R: the substitution bias needs to be addressed in a price index] was that when steak got too expensive, the consumer would substitute hamburger for the steak, and that the inflation measure should reflect the costs tied to buying hamburger versus steak, instead of steak versus steak. Of course, replacing hamburger for steak in the calculations would reduce the inflation rate, but it represented the rate of inflation in terms of maintaining a declining standard of living. Cost of living was being replaced by the cost of survival. The old system told you how much you had to increase your income in order to keep buying steak. The new system promised you hamburger, and then dog food, perhaps, after that.
The 15th series began in September 2005, and in this series hedonic adjustments were introduced to the computing equipment component of index and the new category of financial and insurance services was included. The main component of this new category is deposit and loan facilities which measures changes in the amounts payable as explicit fees and charges, and the amounts payable as interest rate margins. The changes in both these elements then need to be combined to obtain the aggregate or net change in the price of deposit and loan facilities. Out of interest, this new component has increase by 11% in the six years since its introduction.
We begin the 16th series in September 2011, which makes minor changes to the financial services index, and continues with the fundamental acquisitions approach support by the RBA since 1998. Also, the ABS has noted they will provide information on the quality adjustments within is subcategory index to better inform the public on circumstances where quality adjustments take place. Given that the introduction of a hedonic index in the computer equipment subcategory doubled the price declines compared to a more reasonable matched-model index, one would hope that some evidence and documentation of the adjustments occurring in other more heavily weighted subcategories (such as transport) will be forthcoming.
Seen in this light, the CPI becomes little more than an ongoing academic experiment. What makes the experiment all the more worrying is that when the index methodology changes, the CPI measured with a previous methodology is lost for all time. We can’t really understand just how much difference these changes make on a cumulative basis unless we can compare consistent methodologies for longer periods of time.
And yes, I will bring you that in good time.