
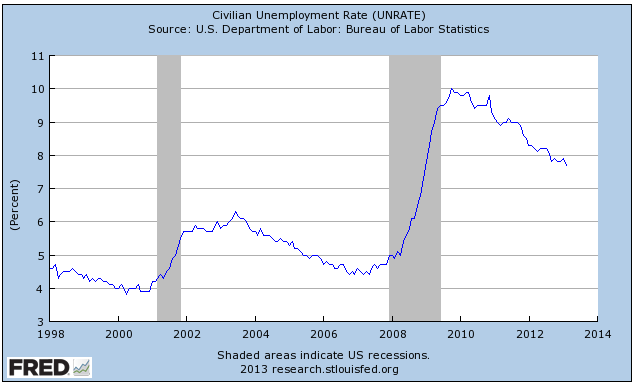
Earlier this week, the Bureau of Labor Statistics (BLS) released labour force data for the US economy, which registered a fall in the official headline unemployment rate to 7.7%, a four year low (see next chart).
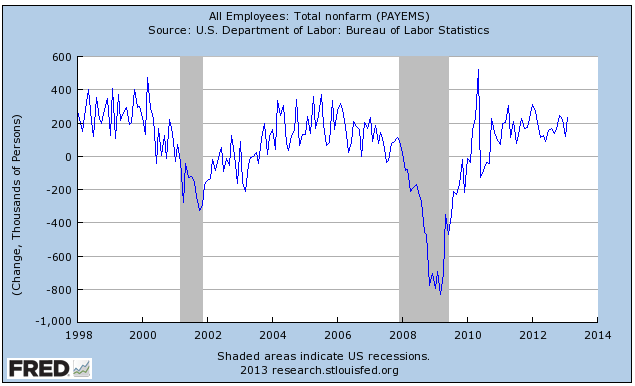
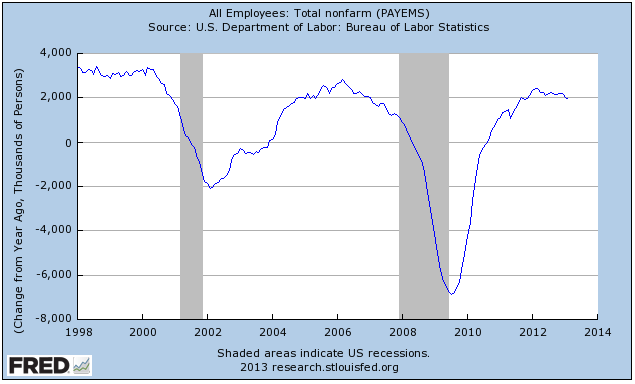
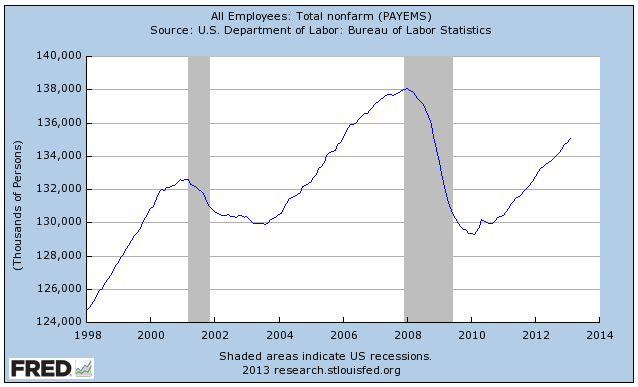
The US economy also added 236,000 non-farm jobs in February 2013 and nearly 2 million jobs over the year (see below charts).
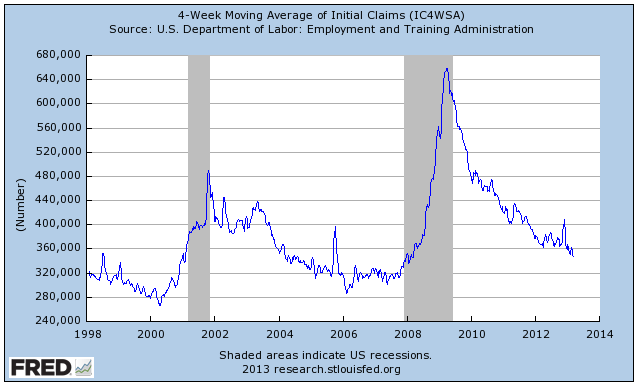
Meanwhile, the number of new people that filed for unemployment benefits (“initial unemployment claims”) in the week ending 9 March fell to 332,000, a decrease of 10,000 from the previous week’s revised figure of 342,000. The 4-week moving average was 346,750, a decrease of 2,750 from the previous week’s revised average of 349,500, and the lowest level since 8 March 2008 (see next chart).
While the US labour market is clearly improving, it is too soon to pop the champagne corks.
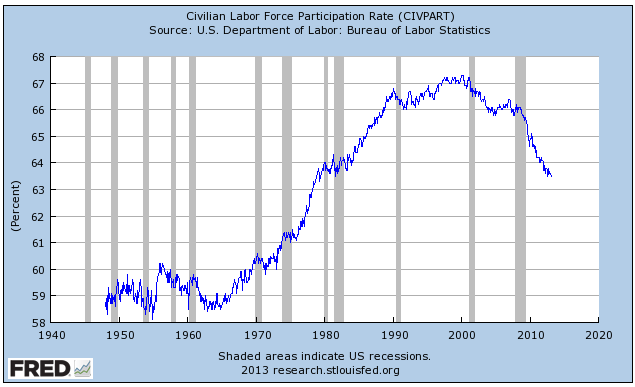
First, the labour force participation rate continues to plummet, falling to just 63.5% in February, which is the lowest participation rate since September 1981 (see next chart).
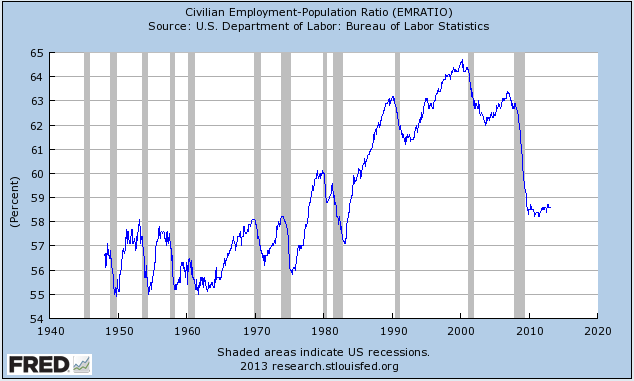
Similarly, the employment-to-population ratio, which was just 58.6% in February, is hovering near levels not seen since the early-1980s (see next chart).
It is also worth noting that total non-farm employment still remains -3 million jobs (-2.2%) below the January 2008 peak (see next chart).
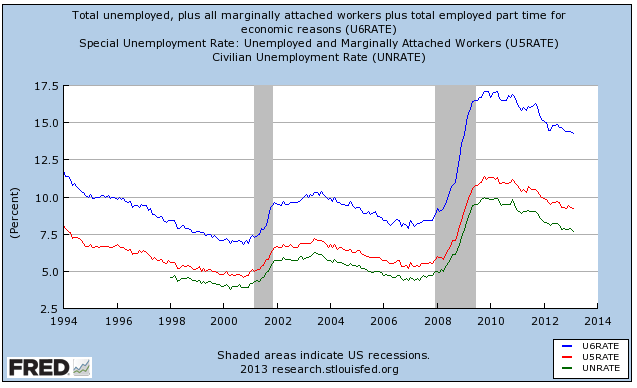
Finally, while the broader measures of unemployment and underemployment – the so-called U5 and U6 rates – have also trended down, they still remain fairly high (see next chart).
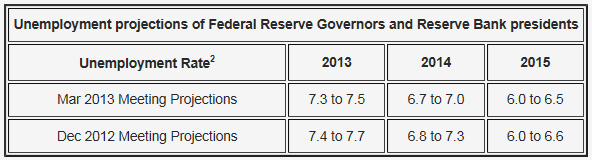
As noted by Houses & Holes earlier today, the Federal Open Market Committee has forecast continued reductions in the official level of US unemployment, which is projected to fall to between 6.0% and 6.5% by 2015 (see next chart).
While such a headline rate would no doubt raise some eye brows, these falls would need to be matched by commensurate gains in the participation rate and jobs before we could confidently claim that the US labour market had recovered.
unconventionaleconomist@hotmail.com
